

to read the full report - Ecolateral by Peter Jones
to read the full report - Ecolateral by Peter Jones
to read the full report - Ecolateral by Peter Jones

You also want an ePaper? Increase the reach of your titles
YUMPU automatically turns print PDFs into web optimized ePapers that Google loves.
122<br />
Evaluation of Opportunities for Converting Indigenous UK Wastes <strong>to</strong> Wastes and Energy<br />
AEA/ED45551/Issue 1<br />
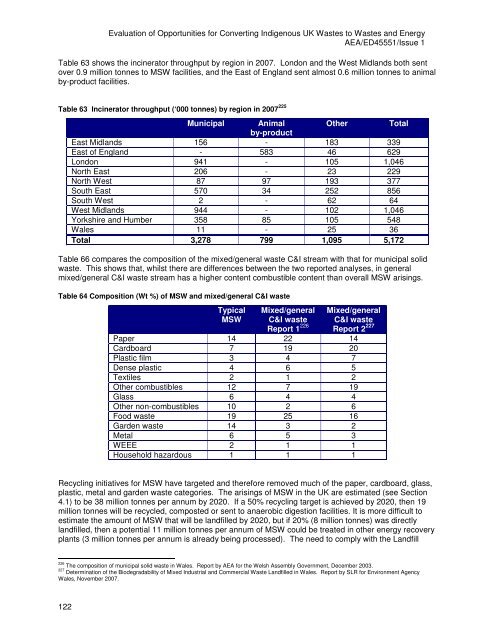
Table 63 shows <strong>the</strong> incinera<strong>to</strong>r throughput <strong>by</strong> region in 2007. London and <strong>the</strong> West Midlands both sent<br />
over 0.9 million <strong>to</strong>nnes <strong>to</strong> MSW facilities, and <strong>the</strong> East of England sent almost 0.6 million <strong>to</strong>nnes <strong>to</strong> animal<br />
<strong>by</strong>-product facilities.<br />
Table 63 Incinera<strong>to</strong>r throughput (‘000 <strong>to</strong>nnes) <strong>by</strong> region in 2007 225<br />
Municipal Animal<br />
<strong>by</strong>-product<br />
O<strong>the</strong>r Total<br />
East Midlands 156 - 183 339<br />
East of England - 583 46 629<br />
London 941 - 105 1,046<br />
North East 206 - 23 229<br />
North West 87 97 193 377<br />
South East 570 34 252 856<br />
South West 2 - 62 64<br />
West Midlands 944 - 102 1,046<br />
Yorkshire and Humber 358 85 105 548<br />
Wales 11 - 25 36<br />
Total 3,278 799 1,095 5,172<br />
Table 66 compares <strong>the</strong> composition of <strong>the</strong> mixed/general waste C&I stream with that for municipal solid<br />
waste. This shows that, whilst <strong>the</strong>re are differences between <strong>the</strong> two <strong>report</strong>ed analyses, in general<br />
mixed/general C&I waste stream has a higher content combustible content than overall MSW arisings.<br />
Table 64 Composition (Wt %) of MSW and mixed/general C&I waste<br />
Typical<br />
MSW<br />
Mixed/general<br />
C&I waste<br />
Report 1 226<br />
Mixed/general<br />
C&I waste<br />
Report 2 227<br />
Paper 14 22 14<br />
Cardboard 7 19 20<br />
Plastic film 3 4 7<br />
Dense plastic 4 6 5<br />
Textiles 2 1 2<br />
O<strong>the</strong>r combustibles 12 7 19<br />
Glass 6 4 4<br />
O<strong>the</strong>r non-combustibles 10 2 6<br />
Food waste 19 25 16<br />
Garden waste 14 3 2<br />
Metal 6 5 3<br />
WEEE 2 1 1<br />
Household hazardous 1 1 1<br />
Recycling initiatives for MSW have targeted and <strong>the</strong>refore removed much of <strong>the</strong> paper, cardboard, glass,<br />
plastic, metal and garden waste categories. The arisings of MSW in <strong>the</strong> UK are estimated (see Section<br />
4.1) <strong>to</strong> be 38 million <strong>to</strong>nnes per annum <strong>by</strong> 2020. If a 50% recycling target is achieved <strong>by</strong> 2020, <strong>the</strong>n 19<br />
million <strong>to</strong>nnes will be recycled, composted or sent <strong>to</strong> anaerobic digestion facilities. It is more difficult <strong>to</strong><br />
estimate <strong>the</strong> amount of MSW that will be landfilled <strong>by</strong> 2020, but if 20% (8 million <strong>to</strong>nnes) was directly<br />
landfilled, <strong>the</strong>n a potential 11 million <strong>to</strong>nnes per annum of MSW could be treated in o<strong>the</strong>r energy recovery<br />
plants (3 million <strong>to</strong>nnes per annum is al<strong>read</strong>y being processed). The need <strong>to</strong> comply with <strong>the</strong> Landfill<br />
226 The composition of municipal solid waste in Wales. Report <strong>by</strong> AEA for <strong>the</strong> Welsh Assembly Government, December 2003.<br />
227 Determination of <strong>the</strong> Biodegradability of Mixed Industrial and Commercial Waste Landfilled in Wales. Report <strong>by</strong> SLR for Environment Agency<br />
Wales, November 2007.


