

to read the full report - Ecolateral by Peter Jones
to read the full report - Ecolateral by Peter Jones
to read the full report - Ecolateral by Peter Jones

Create successful ePaper yourself
Turn your PDF publications into a flip-book with our unique Google optimized e-Paper software.
36<br />
Evaluation of Opportunities for Converting Indigenous UK Wastes <strong>to</strong> Wastes and Energy<br />
AEA/ED45551/Issue 1<br />
Most growth forecasts use growth rates for MSW of 0.75% per annum as this reflects Scenario 3 in <strong>the</strong><br />
national waste strategy. This suggests that MSW will be a stable source of feeds<strong>to</strong>ck for energy in <strong>the</strong><br />
foreseeable future.<br />
Increasing <strong>the</strong> recycling rate <strong>to</strong> <strong>the</strong> 2020 target of 50% will require large-scale collection of food waste<br />
from households; <strong>the</strong> England waste strategy promotes this because of both landfill gas reduction and<br />
energy recovery if food waste is treated using anaerobic digestion. This is a significant opportunity <strong>to</strong><br />
recover renewable energy.<br />
4.2 Commercial and Industrial Wastes (C&I)<br />
4.2.1 Definition<br />
Commercial and Industrial wastes are those arising from premises used for industry, trade or business.<br />
In 2002/3 Industrial and Commercial waste in England <strong>to</strong>talled 68 million <strong>to</strong>nnes. Of this about 38 million<br />
<strong>to</strong>nnes was attributable <strong>to</strong> industry and 30 million <strong>to</strong> commerce.<br />
4.2.2 Composition<br />
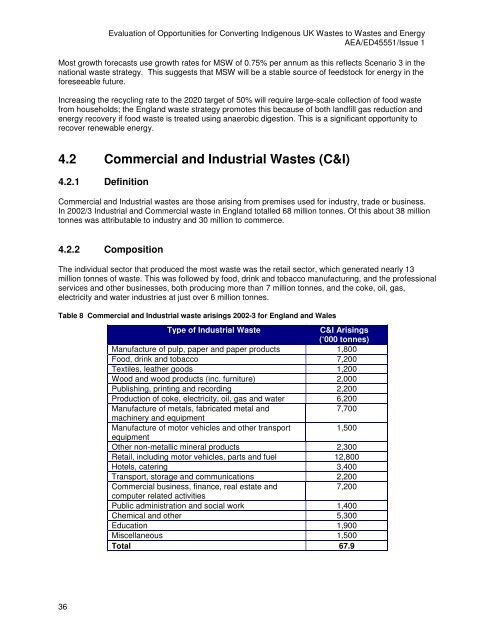
The individual sec<strong>to</strong>r that produced <strong>the</strong> most waste was <strong>the</strong> retail sec<strong>to</strong>r, which generated nearly 13<br />
million <strong>to</strong>nnes of waste. This was followed <strong>by</strong> food, drink and <strong>to</strong>bacco manufacturing, and <strong>the</strong> professional<br />
services and o<strong>the</strong>r businesses, both producing more than 7 million <strong>to</strong>nnes, and <strong>the</strong> coke, oil, gas,<br />
electricity and water industries at just over 6 million <strong>to</strong>nnes.<br />
Table 8 Commercial and Industrial waste arisings 2002-3 for England and Wales<br />
Type of Industrial Waste C&I Arisings<br />
(‘000 <strong>to</strong>nnes)<br />
Manufacture of pulp, paper and paper products 1,800<br />
Food, drink and <strong>to</strong>bacco 7,200<br />
Textiles, lea<strong>the</strong>r goods 1,200<br />
Wood and wood products (inc. furniture) 2,000<br />
Publishing, printing and recording 2,200<br />
Production of coke, electricity, oil, gas and water 6,200<br />
Manufacture of metals, fabricated metal and<br />
machinery and equipment<br />
7,700<br />
Manufacture of mo<strong>to</strong>r vehicles and o<strong>the</strong>r transport<br />
1,500<br />
equipment<br />
O<strong>the</strong>r non-metallic mineral products 2,300<br />
Retail, including mo<strong>to</strong>r vehicles, parts and fuel 12,800<br />
Hotels, catering 3,400<br />
Transport, s<strong>to</strong>rage and communications 2,200<br />
Commercial business, finance, real estate and<br />
7,200<br />
computer related activities<br />
Public administration and social work 1,400<br />
Chemical and o<strong>the</strong>r 5,300<br />
Education 1,900<br />
Miscellaneous 1,500<br />
Total 67.9


