

to read the full report - Ecolateral by Peter Jones
to read the full report - Ecolateral by Peter Jones
to read the full report - Ecolateral by Peter Jones

Create successful ePaper yourself
Turn your PDF publications into a flip-book with our unique Google optimized e-Paper software.
Evaluation of Opportunities for Converting Indigenous UK Wastes <strong>to</strong> Wastes and Energy<br />
AEA/ED45551/Issue 1<br />
4.3.4 Future Arisings<br />
Three surveys of arisings of construction and demolition (C&D) waste in England have been conducted<br />
since <strong>the</strong> year 2000. The findings are summarised in Table 16.<br />
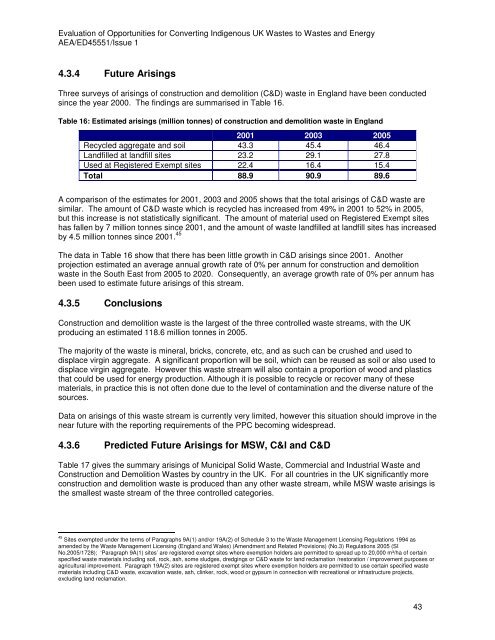
Table 16: Estimated arisings (million <strong>to</strong>nnes) of construction and demolition waste in England<br />
2001 2003 2005<br />
Recycled aggregate and soil 43.3 45.4 46.4<br />
Landfilled at landfill sites 23.2 29.1 27.8<br />
Used at Registered Exempt sites 22.4 16.4 15.4<br />
Total 88.9 90.9 89.6<br />
A comparison of <strong>the</strong> estimates for 2001, 2003 and 2005 shows that <strong>the</strong> <strong>to</strong>tal arisings of C&D waste are<br />
similar. The amount of C&D waste which is recycled has increased from 49% in 2001 <strong>to</strong> 52% in 2005,<br />
but this increase is not statistically significant. The amount of material used on Registered Exempt sites<br />
has fallen <strong>by</strong> 7 million <strong>to</strong>nnes since 2001, and <strong>the</strong> amount of waste landfilled at landfill sites has increased<br />
<strong>by</strong> 4.5 million <strong>to</strong>nnes since 2001. 45<br />
The data in Table 16 show that <strong>the</strong>re has been little growth in C&D arisings since 2001. Ano<strong>the</strong>r<br />
projection estimated an average annual growth rate of 0% per annum for construction and demolition<br />
waste in <strong>the</strong> South East from 2005 <strong>to</strong> 2020. Consequently, an average growth rate of 0% per annum has<br />
been used <strong>to</strong> estimate future arisings of this stream.<br />
4.3.5 Conclusions<br />
Construction and demolition waste is <strong>the</strong> largest of <strong>the</strong> three controlled waste streams, with <strong>the</strong> UK<br />
producing an estimated 118.6 million <strong>to</strong>nnes in 2005.<br />
The majority of <strong>the</strong> waste is mineral, bricks, concrete, etc, and as such can be crushed and used <strong>to</strong><br />
displace virgin aggregate. A significant proportion will be soil, which can be reused as soil or also used <strong>to</strong><br />
displace virgin aggregate. However this waste stream will also contain a proportion of wood and plastics<br />
that could be used for energy production. Although it is possible <strong>to</strong> recycle or recover many of <strong>the</strong>se<br />
materials, in practice this is not often done due <strong>to</strong> <strong>the</strong> level of contamination and <strong>the</strong> diverse nature of <strong>the</strong><br />
sources.<br />
Data on arisings of this waste stream is currently very limited, however this situation should improve in <strong>the</strong><br />
near future with <strong>the</strong> <strong>report</strong>ing requirements of <strong>the</strong> PPC becoming widesp<strong>read</strong>.<br />
4.3.6 Predicted Future Arisings for MSW, C&I and C&D<br />
Table 17 gives <strong>the</strong> summary arisings of Municipal Solid Waste, Commercial and Industrial Waste and<br />
Construction and Demolition Wastes <strong>by</strong> country in <strong>the</strong> UK. For all countries in <strong>the</strong> UK significantly more<br />
construction and demolition waste is produced than any o<strong>the</strong>r waste stream, while MSW waste arisings is<br />
<strong>the</strong> smallest waste stream of <strong>the</strong> three controlled categories.<br />
45 Sites exempted under <strong>the</strong> terms of Paragraphs 9A(1) and/or 19A(2) of Schedule 3 <strong>to</strong> <strong>the</strong> Waste Management Licensing Regulations 1994 as<br />
amended <strong>by</strong> <strong>the</strong> Waste Management Licensing (England and Wales) (Amendment and Related Provisions) (No.3) Regulations 2005 (SI<br />
No.2005/1728); ‘Paragraph 9A(1) sites’ are registered exempt sites where exemption holders are permitted <strong>to</strong> sp<strong>read</strong> up <strong>to</strong> 20,000 m³/ha of certain<br />
specified waste materials including soil, rock, ash, some sludges, dredgings or C&D waste for land reclamation /res<strong>to</strong>ration / improvement purposes or<br />
agricultural improvement. Paragraph 19A(2) sites are registered exempt sites where exemption holders are permitted <strong>to</strong> use certain specified waste<br />
materials including C&D waste, excavation waste, ash, clinker, rock, wood or gypsum in connection with recreational or infrastructure projects,<br />
excluding land reclamation.<br />
43


