

to read the full report - Ecolateral by Peter Jones
to read the full report - Ecolateral by Peter Jones
to read the full report - Ecolateral by Peter Jones

Create successful ePaper yourself
Turn your PDF publications into a flip-book with our unique Google optimized e-Paper software.
184<br />
Evaluation of Opportunities for Converting Indigenous UK Wastes <strong>to</strong> Wastes and Energy<br />
AEA/ED45551/Issue 1<br />
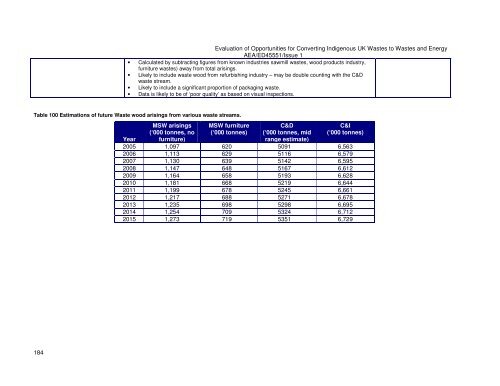
• Calculated <strong>by</strong> subtracting figures from known industries sawmill wastes, wood products industry,<br />
furniture wastes) away from <strong>to</strong>tal arisings.<br />
• Likely <strong>to</strong> include waste wood from refurbishing industry – may be double counting with <strong>the</strong> C&D<br />
waste stream.<br />
• Likely <strong>to</strong> include a significant proportion of packaging waste.<br />
• Data is likely <strong>to</strong> be of ‘poor quality’ as based on visual inspections.<br />
Table 100 Estimations of future Waste wood arisings from various waste streams.<br />
Year<br />
MSW arisings<br />
(‘000 <strong>to</strong>nnes, no<br />
furniture)<br />
MSW furniture<br />
(‘000 <strong>to</strong>nnes)<br />
C&D<br />
(‘000 <strong>to</strong>nnes, mid<br />
range estimate)<br />
C&I<br />
(‘000 <strong>to</strong>nnes)<br />
2005 1,097 620 5091 6,563<br />
2006 1,113 629 5116 6,579<br />
2007 1,130 639 5142 6,595<br />
2008 1,147 648 5167 6,612<br />
2009 1,164 658 5193 6,628<br />
2010 1,181 668 5219 6,644<br />
2011 1,199 678 5245 6,661<br />
2012 1,217 688 5271 6,678<br />
2013 1,235 698 5298 6,695<br />
2014 1,254 709 5324 6,712<br />
2015 1,273 719 5351 6,729


