

to read the full report - Ecolateral by Peter Jones
to read the full report - Ecolateral by Peter Jones
to read the full report - Ecolateral by Peter Jones

You also want an ePaper? Increase the reach of your titles
YUMPU automatically turns print PDFs into web optimized ePapers that Google loves.
32<br />
Evaluation of Opportunities for Converting Indigenous UK Wastes <strong>to</strong> Wastes and Energy<br />
AEA/ED45551/Issue 1<br />
4.1.3 Current Arisings on a National and Regional basis<br />
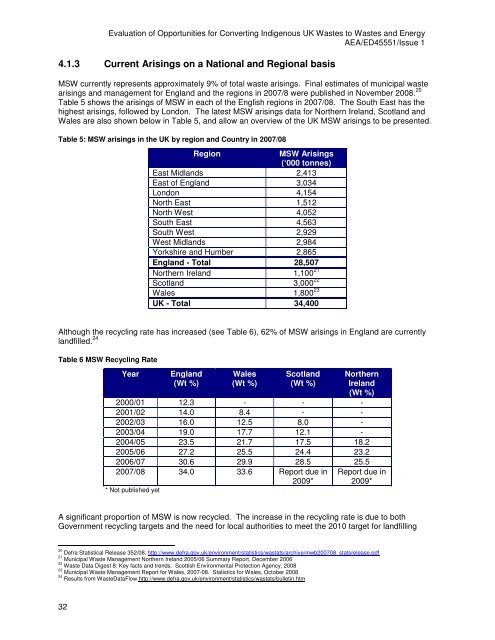
MSW currently represents approximately 9% of <strong>to</strong>tal waste arisings. Final estimates of municipal waste<br />
arisings and management for England and <strong>the</strong> regions in 2007/8 were published in November 2008. 20<br />
Table 5 shows <strong>the</strong> arisings of MSW in each of <strong>the</strong> English regions in 2007/08. The South East has <strong>the</strong><br />
highest arisings, followed <strong>by</strong> London. The latest MSW arisings data for Nor<strong>the</strong>rn Ireland, Scotland and<br />
Wales are also shown below in Table 5, and allow an overview of <strong>the</strong> UK MSW arisings <strong>to</strong> be presented.<br />
Table 5: MSW arisings in <strong>the</strong> UK <strong>by</strong> region and Country in 2007/08<br />
Region MSW Arisings<br />
(‘000 <strong>to</strong>nnes)<br />
East Midlands 2,413<br />
East of England 3,034<br />
London 4,154<br />
North East 1,512<br />
North West 4,052<br />
South East 4,563<br />
South West 2,929<br />
West Midlands 2,984<br />
Yorkshire and Humber 2,865<br />
England - Total 28,507<br />
Nor<strong>the</strong>rn Ireland 1,100 21<br />
Scotland 3,000 22<br />
Wales 1,800 23<br />
UK - Total 34,400<br />
Although <strong>the</strong> recycling rate has increased (see Table 6), 62% of MSW arisings in England are currently<br />
landfilled. 24<br />
Table 6 MSW Recycling Rate<br />
Year England<br />
(Wt %)<br />
Wales<br />
(Wt %)<br />
Scotland<br />
(Wt %)<br />
Nor<strong>the</strong>rn<br />
Ireland<br />
(Wt %)<br />
2000/01 12.3 - - -<br />
2001/02 14.0 8.4 - -<br />
2002/03 16.0 12.5 8.0 -<br />
2003/04 19.0 17.7 12.1 -<br />
2004/05 23.5 21.7 17.5 18.2<br />
2005/06 27.2 25.5 24.4 23.2<br />
2006/07 30.6 29.9 28.5 25.5<br />
2007/08 34.0 33.6 Report due in Report due in<br />
* Not published yet<br />
2009* 2009*<br />
A significant proportion of MSW is now recycled. The increase in <strong>the</strong> recycling rate is due <strong>to</strong> both<br />
Government recycling targets and <strong>the</strong> need for local authorities <strong>to</strong> meet <strong>the</strong> 2010 target for landfilling<br />
20 Defra Statistical Release 352/08, http://www.defra.gov.uk/environment/statistics/wastats/archive/mwb200708_statsrelease.pdf<br />
21 Municipal Waste Management Nor<strong>the</strong>rn Ireland 2005/06 Summary Report, December 2006<br />
22 Waste Data Digest 8: Key facts and trends. Scottish Environmental Protection Agency, 2008<br />
23 Municipal Waste Management Report for Wales, 2007-08. Statistics for Wales, Oc<strong>to</strong>ber 2008<br />
24 Results from WasteDataFlow http://www.defra.gov.uk/environment/statistics/wastats/bulletin.htm


