

to read the full report - Ecolateral by Peter Jones
to read the full report - Ecolateral by Peter Jones
to read the full report - Ecolateral by Peter Jones

You also want an ePaper? Increase the reach of your titles
YUMPU automatically turns print PDFs into web optimized ePapers that Google loves.
72<br />
Evaluation of Opportunities for Converting Indigenous UK Wastes <strong>to</strong> Wastes and Energy<br />
AEA/ED45551/Issue 1<br />
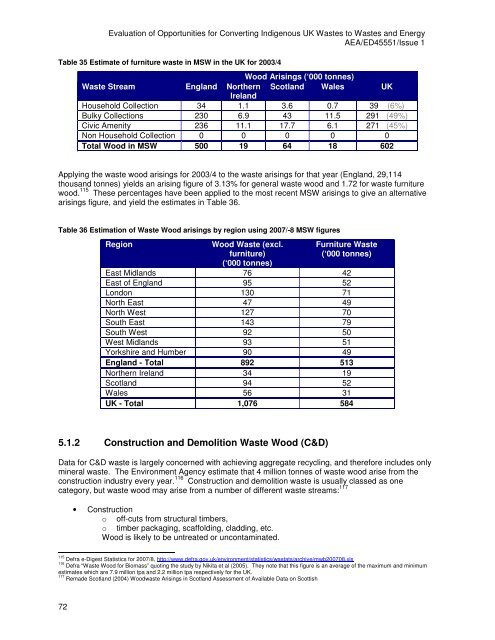
Table 35 Estimate of furniture waste in MSW in <strong>the</strong> UK for 2003/4<br />
Wood Arisings (‘000 <strong>to</strong>nnes)<br />
Waste Stream England Nor<strong>the</strong>rn<br />
Ireland<br />
Scotland Wales UK<br />
Household Collection 34 1.1 3.6 0.7 39 (6%)<br />
Bulky Collections 230 6.9 43 11.5 291 (49%)<br />
Civic Amenity 236 11.1 17.7 6.1 271 (45%)<br />
Non Household Collection 0 0 0 0 0<br />
Total Wood in MSW 500 19 64 18 602<br />
Applying <strong>the</strong> waste wood arisings for 2003/4 <strong>to</strong> <strong>the</strong> waste arisings for that year (England, 29,114<br />
thousand <strong>to</strong>nnes) yields an arising figure of 3.13% for general waste wood and 1.72 for waste furniture<br />
wood. 115 These percentages have been applied <strong>to</strong> <strong>the</strong> most recent MSW arisings <strong>to</strong> give an alternative<br />
arisings figure, and yield <strong>the</strong> estimates in Table 36.<br />
Table 36 Estimation of Waste Wood arisings <strong>by</strong> region using 2007/-8 MSW figures<br />
Region Wood Waste (excl.<br />
furniture)<br />
(‘000 <strong>to</strong>nnes)<br />
Furniture Waste<br />
(‘000 <strong>to</strong>nnes)<br />
East Midlands 76 42<br />
East of England 95 52<br />
London 130 71<br />
North East 47 49<br />
North West 127 70<br />
South East 143 79<br />
South West 92 50<br />
West Midlands 93 51<br />
Yorkshire and Humber 90 49<br />
England - Total 892 513<br />
Nor<strong>the</strong>rn Ireland 34 19<br />
Scotland 94 52<br />
Wales 56 31<br />
UK - Total 1,076 584<br />
5.1.2 Construction and Demolition Waste Wood (C&D)<br />
Data for C&D waste is largely concerned with achieving aggregate recycling, and <strong>the</strong>refore includes only<br />
mineral waste. The Environment Agency estimate that 4 million <strong>to</strong>nnes of waste wood arise from <strong>the</strong><br />
construction industry every year. 116 Construction and demolition waste is usually classed as one<br />
category, but waste wood may arise from a number of different waste streams: 117<br />
• Construction<br />
o off-cuts from structural timbers,<br />
o timber packaging, scaffolding, cladding, etc.<br />
Wood is likely <strong>to</strong> be untreated or uncontaminated.<br />
115 Defra e-Digest Statistics for 2007/8, http://www.defra.gov.uk/environment/statistics/wastats/archive/mwb200708.xls<br />
116 Defra “Waste Wood for Biomass” quoting <strong>the</strong> study <strong>by</strong> Nikita et al (2005). They note that this figure is an average of <strong>the</strong> maximum and minimum<br />
estimates which are 7.9 million tpa and 2.2 million tpa respectively for <strong>the</strong> UK.<br />
117 Remade Scotland (2004) Woodwaste Arisings in Scotland Assessment of Available Data on Scottish


