

to read the full report - Ecolateral by Peter Jones
to read the full report - Ecolateral by Peter Jones
to read the full report - Ecolateral by Peter Jones

You also want an ePaper? Increase the reach of your titles
YUMPU automatically turns print PDFs into web optimized ePapers that Google loves.
78<br />
Evaluation of Opportunities for Converting Indigenous UK Wastes <strong>to</strong> Wastes and Energy<br />
AEA/ED45551/Issue 1<br />
comparison <strong>the</strong> Napier University Report provides an indication of <strong>the</strong> different waste streams within <strong>the</strong><br />
commercial and industrial sec<strong>to</strong>r and also includes compositional analysis for <strong>the</strong> mixed waste.<br />
Table 40 Industrial and Commercial Food Waste for England, Wales and Scotland<br />
Country Commercial Industrial<br />
Total<br />
(‘000 <strong>to</strong>nnes) (‘000 <strong>to</strong>nnes) (‘000 <strong>to</strong>nnes)<br />
England 127 6,067 4,121 6,189<br />
Wales 125 211 51 262<br />
Scotland 126 - - 457<br />
Note: Totals do not calculate correctly due <strong>to</strong> rounding<br />
O<strong>the</strong>r studies<br />
O<strong>the</strong>r studies have been undertaken, which focus and specific geographical areas or industry sec<strong>to</strong>rs.<br />
While reference <strong>to</strong> <strong>the</strong>se is not helpful in providing an overview for each country, <strong>the</strong>se <strong>report</strong>s would be<br />
able <strong>to</strong> provide a more detailed picture for specific areas.<br />
• Research undertaken for Defra and <strong>the</strong> Food and Drink Federation (FDF) provides a snapshot of<br />
food waste arisings across FDF members in 2006. 128 It was conducted at 236 sites, <strong>by</strong><br />
organisations with a combined turnover of £17bn. 129 The survey included data on packaging<br />
waste, mixed waste and food waste – shown in Table 41. Fur<strong>the</strong>r food waste arising will be in <strong>the</strong><br />
mixed food and packaging waste, however <strong>the</strong> composition of this waste stream was not<br />
considered <strong>by</strong> <strong>the</strong> study.<br />
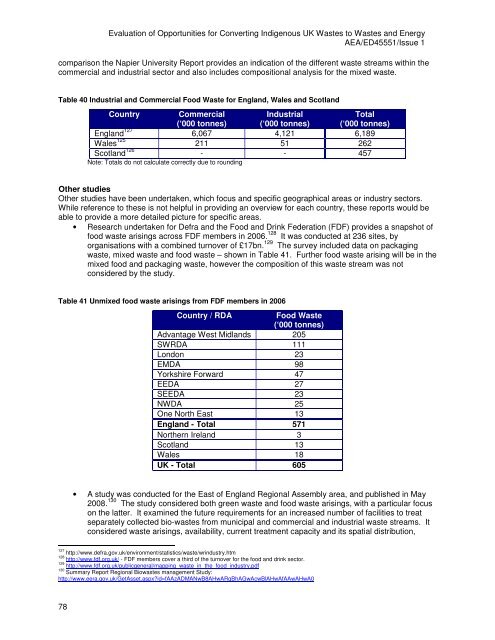
Table 41 Unmixed food waste arisings from FDF members in 2006<br />
Country / RDA Food Waste<br />
(‘000 <strong>to</strong>nnes)<br />
Advantage West Midlands 205<br />
SWRDA 111<br />
London 23<br />
EMDA 98<br />
Yorkshire Forward 47<br />
EEDA 27<br />
SEEDA 23<br />
NWDA 25<br />
One North East 13<br />
England - Total 571<br />
Nor<strong>the</strong>rn Ireland 3<br />
Scotland 13<br />
Wales 18<br />
UK - Total 605<br />
• A study was conducted for <strong>the</strong> East of England Regional Assembly area, and published in May<br />
2008. 130 The study considered both green waste and food waste arisings, with a particular focus<br />
on <strong>the</strong> latter. It examined <strong>the</strong> future requirements for an increased number of facilities <strong>to</strong> treat<br />
separately collected bio-wastes from municipal and commercial and industrial waste streams. It<br />
considered waste arisings, availability, current treatment capacity and its spatial distribution,<br />
127 http://www.defra.gov.uk/environment/statistics/waste/wrindustry.htm<br />
128 http://www.fdf.org.uk/ - FDF members cover a third of <strong>the</strong> turnover for <strong>the</strong> food and drink sec<strong>to</strong>r.<br />
129 http://www.fdf.org.uk/publicgeneral/mapping_waste_in_<strong>the</strong>_food_industry.pdf<br />
130 Summary Report Regional Biowastes management Study:<br />
http://www.eera.gov.uk/GetAsset.aspx?id=fAAzADMANwB8AHwARgBhAGwAcwBlAHwAfAAwAHwA0


