

to read the full report - Ecolateral by Peter Jones
to read the full report - Ecolateral by Peter Jones
to read the full report - Ecolateral by Peter Jones

Create successful ePaper yourself
Turn your PDF publications into a flip-book with our unique Google optimized e-Paper software.
34<br />
Evaluation of Opportunities for Converting Indigenous UK Wastes <strong>to</strong> Wastes and Energy<br />
AEA/ED45551/Issue 1<br />
One European study has assessed <strong>the</strong> fac<strong>to</strong>rs affecting household consumption, and <strong>the</strong> effects on <strong>the</strong><br />
environment (resource use, energy use and waste). 26 Ano<strong>the</strong>r European study developed a model which<br />
assesses <strong>the</strong> effects of food, recreation, ‘infotainment’, care, clothing, and housing on waste growth and<br />
used this <strong>to</strong> model four scenarios which all assumed continued economic growth but had different future<br />
lifestyles. 27 The results of both showed that waste continued <strong>to</strong> grow - sometimes considerably higher<br />
than GDP growth rate, sometimes in line with GDP growth rate, and sometimes at lower than GDP growth<br />
rates.<br />
Data on MSW arisings from a number of European countries from 1997 <strong>to</strong> 2003 indicate that in some<br />
countries (e.g. Belgium and <strong>the</strong> Ne<strong>the</strong>rlands) waste arisings are growing more slowly than GDP growth. 28<br />
The data also suggests that countries that have higher MSW recycling rates are seeing lower growth<br />
rates in MSW arisings; this may be because <strong>the</strong> impacts due <strong>to</strong> many years of publicity/education<br />
information on waste awareness and recycling are now becoming noticeable. However, this trend does<br />
not appear <strong>to</strong> be evident in ei<strong>the</strong>r France or Germany.<br />
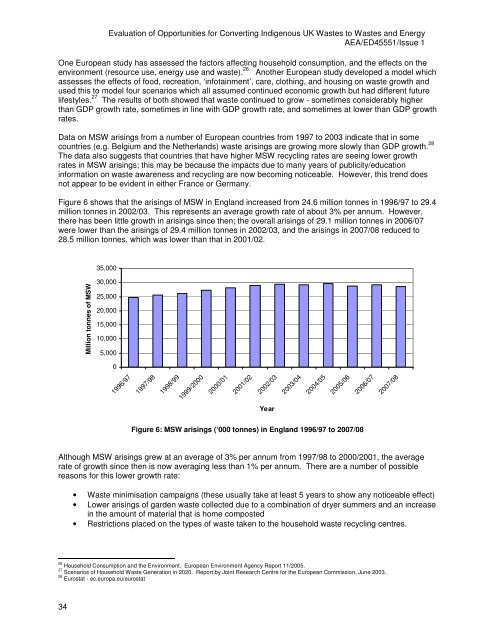
Figure 6 shows that <strong>the</strong> arisings of MSW in England increased from 24.6 million <strong>to</strong>nnes in 1996/97 <strong>to</strong> 29.4<br />
million <strong>to</strong>nnes in 2002/03. This represents an average growth rate of about 3% per annum. However,<br />
<strong>the</strong>re has been little growth in arisings since <strong>the</strong>n; <strong>the</strong> overall arisings of 29.1 million <strong>to</strong>nnes in 2006/07<br />
were lower than <strong>the</strong> arisings of 29.4 million <strong>to</strong>nnes in 2002/03, and <strong>the</strong> arisings in 2007/08 reduced <strong>to</strong><br />
28.5 million <strong>to</strong>nnes, which was lower than that in 2001/02.<br />
Million <strong>to</strong>nnes of MSW<br />
35,000<br />
30,000<br />
25,000<br />
20,000<br />
15,000<br />
10,000<br />
5,000<br />
0<br />
1996/97<br />
1997/98<br />
1998/99<br />
1999/2000<br />
2000/01<br />
2001/02<br />
2002/03<br />
Year<br />
2003/04<br />
2004/05<br />
2005/06<br />
Figure 6: MSW arisings (‘000 <strong>to</strong>nnes) in England 1996/97 <strong>to</strong> 2007/08<br />
Although MSW arisings grew at an average of 3% per annum from 1997/98 <strong>to</strong> 2000/2001, <strong>the</strong> average<br />
rate of growth since <strong>the</strong>n is now averaging less than 1% per annum. There are a number of possible<br />
reasons for this lower growth rate:<br />
• Waste minimisation campaigns (<strong>the</strong>se usually take at least 5 years <strong>to</strong> show any noticeable effect)<br />
• Lower arisings of garden waste collected due <strong>to</strong> a combination of dryer summers and an increase<br />
in <strong>the</strong> amount of material that is home composted<br />
• Restrictions placed on <strong>the</strong> types of waste taken <strong>to</strong> <strong>the</strong> household waste recycling centres.<br />
2006/07<br />
26 Household Consumption and <strong>the</strong> Environment. European Environment Agency Report 11/2005.<br />
27 Scenarios of Household Waste Generation in 2020. Report <strong>by</strong> Joint Research Centre for <strong>the</strong> European Commission, June 2003.<br />
28 Eurostat - ec.europa.eu/eurostat<br />
2007/08


