

to read the full report - Ecolateral by Peter Jones
to read the full report - Ecolateral by Peter Jones
to read the full report - Ecolateral by Peter Jones

You also want an ePaper? Increase the reach of your titles
YUMPU automatically turns print PDFs into web optimized ePapers that Google loves.
28<br />
Evaluation of Opportunities for Converting Indigenous UK Wastes <strong>to</strong> Wastes and Energy<br />
AEA/ED45551/Issue 1<br />
There is also little data on <strong>the</strong> amount of C&D waste used at licensed exempt sites (sites which are<br />
registered as exempt from waste licensing requirements). 4 However, changes in PPC requirements<br />
mean that all sites will have <strong>to</strong> provide data on waste inputs, and proposed changes will require <strong>report</strong>ing<br />
of data on <strong>the</strong> amount of C&D waste used at registered exempt sites. These changes will improve <strong>the</strong><br />
quality of data on <strong>the</strong> amount of waste recycled when <strong>the</strong>y have been <strong>full</strong>y implemented, and <strong>to</strong>ge<strong>the</strong>r<br />
with o<strong>the</strong>r changes, should improve <strong>the</strong> overall quality of data on arisings of both C&I and C&D waste <strong>by</strong><br />
2012.<br />
3.3 Overall waste arisings in <strong>the</strong> UK<br />
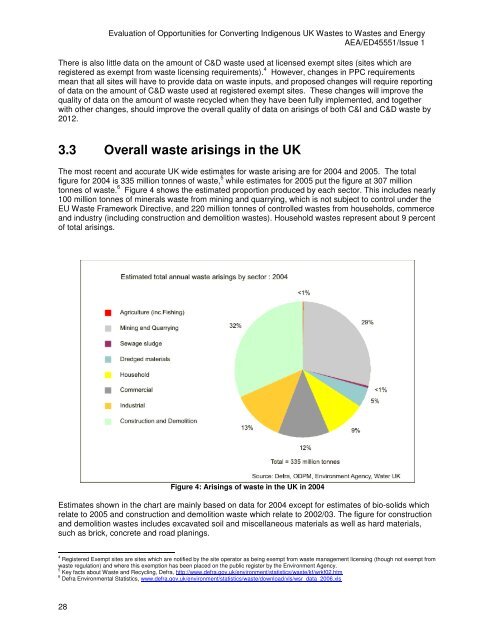
The most recent and accurate UK wide estimates for waste arising are for 2004 and 2005. The <strong>to</strong>tal<br />
figure for 2004 is 335 million <strong>to</strong>nnes of waste, 5 while estimates for 2005 put <strong>the</strong> figure at 307 million<br />
<strong>to</strong>nnes of waste. 6 Figure 4 shows <strong>the</strong> estimated proportion produced <strong>by</strong> each sec<strong>to</strong>r. This includes nearly<br />
100 million <strong>to</strong>nnes of minerals waste from mining and quarrying, which is not subject <strong>to</strong> control under <strong>the</strong><br />
EU Waste Framework Directive, and 220 million <strong>to</strong>nnes of controlled wastes from households, commerce<br />
and industry (including construction and demolition wastes). Household wastes represent about 9 percent<br />
of <strong>to</strong>tal arisings.<br />
Figure 4: Arisings of waste in <strong>the</strong> UK in 2004<br />
Estimates shown in <strong>the</strong> chart are mainly based on data for 2004 except for estimates of bio-solids which<br />
relate <strong>to</strong> 2005 and construction and demolition waste which relate <strong>to</strong> 2002/03. The figure for construction<br />
and demolition wastes includes excavated soil and miscellaneous materials as well as hard materials,<br />
such as brick, concrete and road planings.<br />
4 Registered Exempt sites are sites which are notified <strong>by</strong> <strong>the</strong> site opera<strong>to</strong>r as being exempt from waste management licensing (though not exempt from<br />
waste regulation) and where this exemption has been placed on <strong>the</strong> public register <strong>by</strong> <strong>the</strong> Environment Agency.<br />
5 Key facts about Waste and Recycling, Defra, http://www.defra.gov.uk/environment/statistics/waste/kf/wrkf02.htm<br />
6 Defra Environmental Statistics, www.defra.gov.uk/environment/statistics/waste/download/xls/wsr_data_2006.xls


