

to read the full report - Ecolateral by Peter Jones
to read the full report - Ecolateral by Peter Jones
to read the full report - Ecolateral by Peter Jones

You also want an ePaper? Increase the reach of your titles
YUMPU automatically turns print PDFs into web optimized ePapers that Google loves.
Evaluation of Opportunities for Converting Indigenous UK Wastes <strong>to</strong> Wastes and Energy<br />
AEA/ED45551/Issue 1<br />
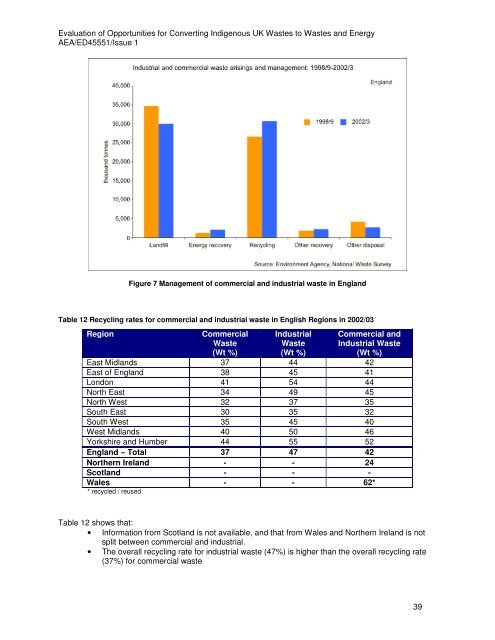
Figure 7 Management of commercial and industrial waste in England<br />
Table 12 Recycling rates for commercial and industrial waste in English Regions in 2002/03<br />
Region Commercial<br />
Waste<br />
(Wt %)<br />
Industrial<br />
Waste<br />
(Wt %)<br />
Commercial and<br />
Industrial Waste<br />
(Wt %)<br />
East Midlands 37 44 42<br />
East of England 38 45 41<br />
London 41 54 44<br />
North East 34 49 45<br />
North West 32 37 35<br />
South East 30 35 32<br />
South West 35 45 40<br />
West Midlands 40 50 46<br />
Yorkshire and Humber 44 55 52<br />
England – Total 37 47 42<br />
Nor<strong>the</strong>rn Ireland - - 24<br />
Scotland - - -<br />
Wales - - 62*<br />
* recycled / reused<br />
Table 12 shows that:<br />
• Information from Scotland is not available, and that from Wales and Nor<strong>the</strong>rn Ireland is not<br />
split between commercial and industrial.<br />
• The overall recycling rate for industrial waste (47%) is higher than <strong>the</strong> overall recycling rate<br />
(37%) for commercial waste<br />
39


