

to read the full report - Ecolateral by Peter Jones
to read the full report - Ecolateral by Peter Jones
to read the full report - Ecolateral by Peter Jones

Create successful ePaper yourself
Turn your PDF publications into a flip-book with our unique Google optimized e-Paper software.
56<br />
Evaluation of Opportunities for Converting Indigenous UK Wastes <strong>to</strong> Wastes and Energy<br />
AEA/ED45551/Issue 1<br />
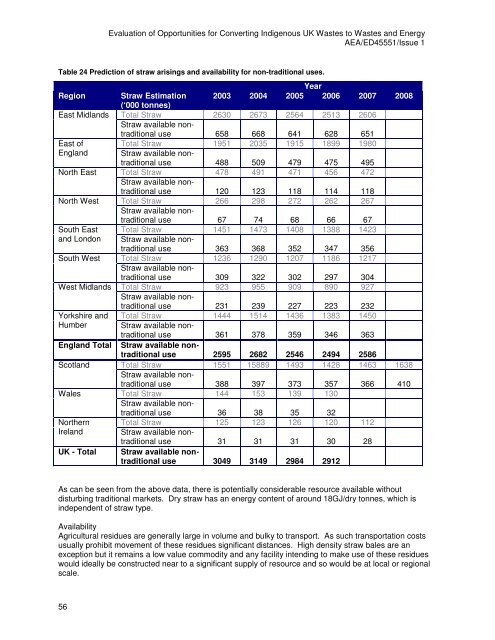
Table 24 Prediction of straw arisings and availability for non-traditional uses.<br />
Year<br />
Region Straw Estimation<br />
(‘000 <strong>to</strong>nnes)<br />
2003 2004 2005 2006 2007 2008<br />
East Midlands Total Straw<br />
Straw available non-<br />
2630 2673 2564 2513 2606<br />
traditional use 658 668 641 628 651<br />
East of Total Straw 1951 2035 1915 1899 1980<br />
England Straw available nontraditional<br />
use 488 509 479 475 495<br />
North East Total Straw<br />
Straw available non-<br />
478 491 471 456 472<br />
traditional use 120 123 118 114 118<br />
North West Total Straw<br />
Straw available non-<br />
266 298 272 262 267<br />
traditional use 67 74 68 66 67<br />
South East Total Straw 1451 1473 1408 1388 1423<br />
and London Straw available nontraditional<br />
use 363 368 352 347 356<br />
South West Total Straw<br />
Straw available non-<br />
1236 1290 1207 1186 1217<br />
traditional use 309 322 302 297 304<br />
West Midlands Total Straw<br />
Straw available non-<br />
923 955 909 890 927<br />
traditional use 231 239 227 223 232<br />
Yorkshire and Total Straw 1444 1514 1436 1383 1450<br />
Humber Straw available nontraditional<br />
use 361 378 359 346 363<br />
England Total Straw available nontraditional<br />
use 2595 2682 2546 2494 2586<br />
Scotland Total Straw<br />
Straw available non-<br />
1551 15889 1493 1428 1463 1638<br />
traditional use 388 397 373 357 366 410<br />
Wales Total Straw<br />
Straw available non-<br />
144 153 139 130<br />
traditional use 36 38 35 32<br />
Nor<strong>the</strong>rn Total Straw 125 123 126 120 112<br />
Ireland Straw available nontraditional<br />
use 31 31 31 30 28<br />
UK - Total Straw available nontraditional<br />
use 3049 3149 2984 2912<br />
As can be seen from <strong>the</strong> above data, <strong>the</strong>re is potentially considerable resource available without<br />
disturbing traditional markets. Dry straw has an energy content of around 18GJ/dry <strong>to</strong>nnes, which is<br />
independent of straw type.<br />
Availability<br />
Agricultural residues are generally large in volume and bulky <strong>to</strong> transport. As such transportation costs<br />
usually prohibit movement of <strong>the</strong>se residues significant distances. High density straw bales are an<br />
exception but it remains a low value commodity and any facility intending <strong>to</strong> make use of <strong>the</strong>se residues<br />
would ideally be constructed near <strong>to</strong> a significant supply of resource and so would be at local or regional<br />
scale.


