

to read the full report - Ecolateral by Peter Jones
to read the full report - Ecolateral by Peter Jones
to read the full report - Ecolateral by Peter Jones

Create successful ePaper yourself
Turn your PDF publications into a flip-book with our unique Google optimized e-Paper software.
30<br />
Evaluation of Opportunities for Converting Indigenous UK Wastes <strong>to</strong> Wastes and Energy<br />
AEA/ED45551/Issue 1<br />
4 Arisings <strong>by</strong> Waste Type<br />
In this Chapter we consider <strong>the</strong> <strong>to</strong>tal arisings for <strong>the</strong> major wastes and residues on a national and regional<br />
basis. We discuss <strong>the</strong>se in this chapter according <strong>to</strong> <strong>the</strong>ir origin.<br />
The waste streams considered are: Municipal Solid Wastes (MSW); Commercial and Industrial wastes<br />
(C&I); Construction and Demolition (C&D); Bio-solids; Agricultural residues, both Wet and Dry residues,<br />
and; Forestry Residues.<br />
The regional subdivisions used were <strong>the</strong> 9 regional development areas for England, as well as <strong>the</strong><br />
devolved regions of Scotland, Wales and Nor<strong>the</strong>rn Ireland. Where reliable information is available, <strong>the</strong><br />
disposal route used <strong>by</strong> each region for <strong>the</strong> wastes and residues has also been discussed, although <strong>the</strong>re<br />
is little information for many waste streams.<br />
4.1 Municipal Solid Wastes (MSW)<br />
4.1.1 Definition<br />
Municipal Solid Waste, commonly referred <strong>to</strong> as MSW is waste collected <strong>by</strong>, or on behalf of, a local<br />
authority, which has a legal duty <strong>to</strong> manage such wastes. MSW is comprised of:<br />
• household waste<br />
• civic amenity waste<br />
• recycling centre arisings<br />
• street litter<br />
• fly-tipped waste<br />
• commercial waste collected <strong>by</strong> local authorities.<br />
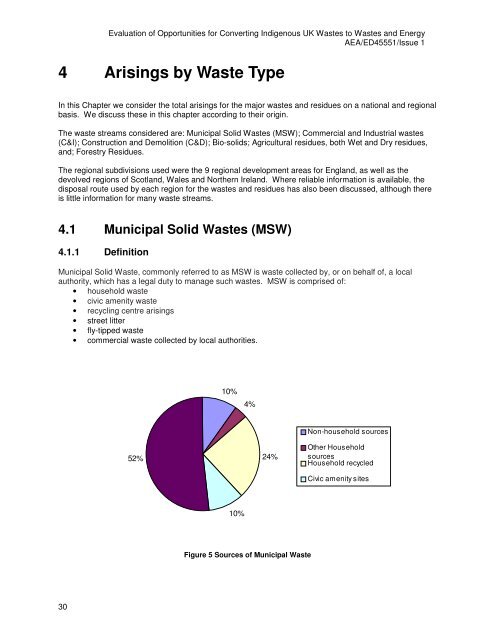
52%<br />
10%<br />
10%<br />
4%<br />
24%<br />
Figure 5 Sources of Municipal Waste<br />
Non-household sources<br />
O<strong>the</strong>r Household<br />
sources<br />
Household recycled<br />
Civic amenity sites


