

to read the full report - Ecolateral by Peter Jones
to read the full report - Ecolateral by Peter Jones
to read the full report - Ecolateral by Peter Jones

Create successful ePaper yourself
Turn your PDF publications into a flip-book with our unique Google optimized e-Paper software.
42<br />
Evaluation of Opportunities for Converting Indigenous UK Wastes <strong>to</strong> Wastes and Energy<br />
AEA/ED45551/Issue 1<br />
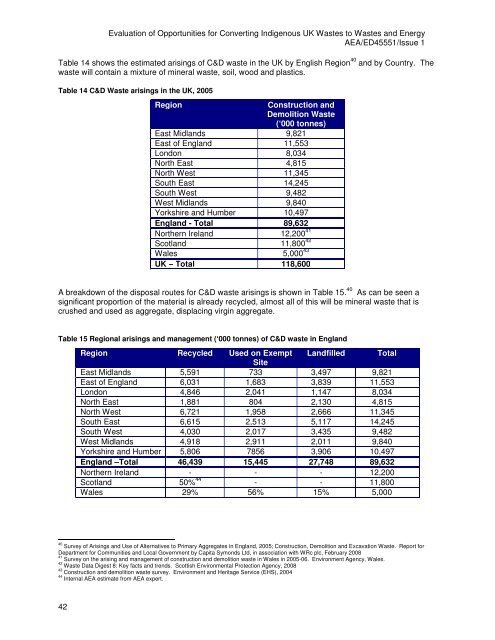
Table 14 shows <strong>the</strong> estimated arisings of C&D waste in <strong>the</strong> UK <strong>by</strong> English Region 40 and <strong>by</strong> Country. The<br />
waste will contain a mixture of mineral waste, soil, wood and plastics.<br />
Table 14 C&D Waste arisings in <strong>the</strong> UK, 2005<br />
Region Construction and<br />
Demolition Waste<br />
(‘000 <strong>to</strong>nnes)<br />
East Midlands 9,821<br />
East of England 11,553<br />
London 8,034<br />
North East 4,815<br />
North West 11,345<br />
South East 14,245<br />
South West 9,482<br />
West Midlands 9,840<br />
Yorkshire and Humber 10,497<br />
England - Total 89,632<br />
Nor<strong>the</strong>rn Ireland 12,200 41<br />
Scotland 11,800 42<br />
Wales 5,000 43<br />
UK – Total 118,600<br />
A breakdown of <strong>the</strong> disposal routes for C&D waste arisings is shown in Table 15. 40 As can be seen a<br />
significant proportion of <strong>the</strong> material is al<strong>read</strong>y recycled, almost all of this will be mineral waste that is<br />
crushed and used as aggregate, displacing virgin aggregate.<br />
Table 15 Regional arisings and management (‘000 <strong>to</strong>nnes) of C&D waste in England<br />
Region Recycled Used on Exempt<br />
Site<br />
Landfilled Total<br />
East Midlands 5,591 733 3,497 9,821<br />
East of England 6,031 1,683 3,839 11,553<br />
London 4,846 2,041 1,147 8,034<br />
North East 1,881 804 2,130 4,815<br />
North West 6,721 1,958 2,666 11,345<br />
South East 6,615 2,513 5,117 14,245<br />
South West 4,030 2,017 3,435 9,482<br />
West Midlands 4,918 2,911 2,011 9,840<br />
Yorkshire and Humber 5,806 7856 3,906 10,497<br />
England –Total 46,439 15,445 27,748 89,632<br />
Nor<strong>the</strong>rn Ireland - - - 12,200<br />
Scotland 50% 44 - - 11,800<br />
Wales 29% 56% 15% 5,000<br />
40 Survey of Arisings and Use of Alternatives <strong>to</strong> Primary Aggregates in England, 2005; Construction, Demolition and Excavation Waste. Report for<br />
Department for Communities and Local Government <strong>by</strong> Capita Symonds Ltd, in association with WRc plc, February 2008<br />
41 Survey on <strong>the</strong> arising and management of construction and demolition waste in Wales in 2005-06. Environment Agency, Wales.<br />
42 Waste Data Digest 8: Key facts and trends. Scottish Environmental Protection Agency, 2008<br />
43 Construction and demolition waste survey. Environment and Heritage Service (EHS), 2004<br />
44 Internal AEA estimate from AEA expert.


