

to read the full report - Ecolateral by Peter Jones
to read the full report - Ecolateral by Peter Jones
to read the full report - Ecolateral by Peter Jones

Create successful ePaper yourself
Turn your PDF publications into a flip-book with our unique Google optimized e-Paper software.
Evaluation of Opportunities for Converting Indigenous UK Wastes <strong>to</strong> Wastes and Energy<br />
AEA/ED45551/Issue 1<br />
5.4 Textiles Waste Arising<br />
Background<br />
It is estimated that more than 1 million <strong>to</strong>nnes of textiles are thrown away every year, most of which is<br />
post-consumer waste. At least 50% of <strong>the</strong> textiles that are thrown away are recyclable. However, <strong>the</strong><br />
proportion of textile wastes reused or recycled annually in <strong>the</strong> UK is only around 25%. 136 Besides postconsumer<br />
waste, post-industrial waste arises during yarn and fabric manufacture, <strong>the</strong> garment-making<br />
processes and from <strong>the</strong> retail industry. Textile waste arises as standard in two waste streams: MSW and<br />
C&I.<br />
Current Arisings<br />
Several sources have identified <strong>the</strong> proportion of textile waste in MSW as approximately 1.9%. 137<br />
Meanwhile C&I textile arisings are estimated <strong>to</strong> be 1-2% of <strong>the</strong> waste stream in Section 4.2.<br />
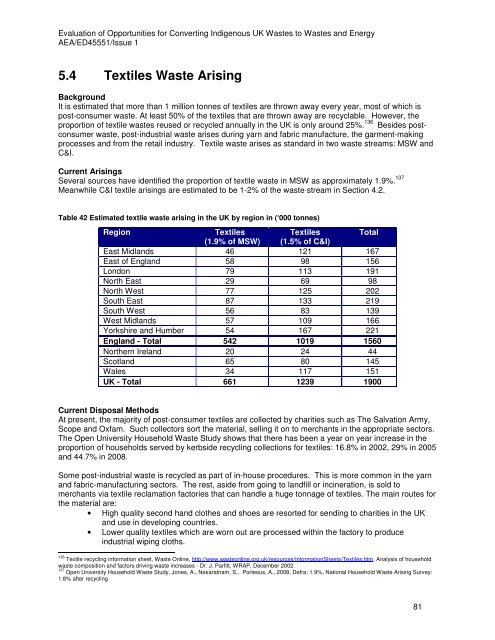
Table 42 Estimated textile waste arising in <strong>the</strong> UK <strong>by</strong> region in (‘000 <strong>to</strong>nnes)<br />
Region Textiles<br />
Textiles Total<br />
(1.9% of MSW) (1.5% of C&I)<br />
East Midlands 46 121 167<br />
East of England 58 98 156<br />
London 79 113 191<br />
North East 29 69 98<br />
North West 77 125 202<br />
South East 87 133 219<br />
South West 56 83 139<br />
West Midlands 57 109 166<br />
Yorkshire and Humber 54 167 221<br />
England - Total 542 1019 1560<br />
Nor<strong>the</strong>rn Ireland 20 24 44<br />
Scotland 65 80 145<br />
Wales 34 117 151<br />
UK - Total 661 1239 1900<br />
Current Disposal Methods<br />
At present, <strong>the</strong> majority of post-consumer textiles are collected <strong>by</strong> charities such as The Salvation Army,<br />
Scope and Oxfam. Such collec<strong>to</strong>rs sort <strong>the</strong> material, selling it on <strong>to</strong> merchants in <strong>the</strong> appropriate sec<strong>to</strong>rs.<br />
The Open University Household Waste Study shows that <strong>the</strong>re has been a year on year increase in <strong>the</strong><br />
proportion of households served <strong>by</strong> kerbside recycling collections for textiles: 16.8% in 2002, 29% in 2005<br />
and 44.7% in 2008.<br />
Some post-industrial waste is recycled as part of in-house procedures. This is more common in <strong>the</strong> yarn<br />
and fabric-manufacturing sec<strong>to</strong>rs. The rest, aside from going <strong>to</strong> landfill or incineration, is sold <strong>to</strong><br />
merchants via textile reclamation fac<strong>to</strong>ries that can handle a huge <strong>to</strong>nnage of textiles. The main routes for<br />
<strong>the</strong> material are:<br />
• High quality second hand clo<strong>the</strong>s and shoes are resorted for sending <strong>to</strong> charities in <strong>the</strong> UK<br />
and use in developing countries.<br />
• Lower quality textiles which are worn out are processed within <strong>the</strong> fac<strong>to</strong>ry <strong>to</strong> produce<br />
industrial wiping cloths.<br />
136 Textile recycling information sheet, Waste Online, http://www.wasteonline.org.uk/resources/InformationSheets/Textiles.htm, Analysis of household<br />
waste composition and fac<strong>to</strong>rs driving waste increases - Dr. J. Parfitt, WRAP, December 2002.<br />
137 Open University Household Waste Study, <strong>Jones</strong>, A., Nesaratnam, S., Porteous, A., 2008, Defra: 1.9%, National Household Waste Arising Survey:<br />
1.8% after recycling<br />
81


