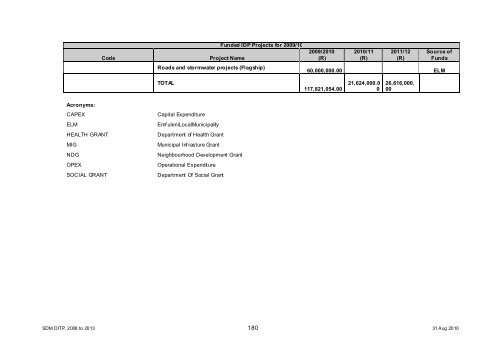
Code Funded IDP Projects for 2009/10 Project Name Roads and stormwater projects (Flagship) 2009/2010 (R) 2010/<strong>11</strong> (R) 20<strong>11</strong>/12 (R) Source of Funds 60,000,000.00 ELM TOTAL <strong>11</strong>7,821,054.00 21,624,000.0 0 26,616,000. 00 Acronyms: CAPEX Capital Expenditure ELM Emf uleniLocal<strong>Municipality</strong> HEALTH GRANT Department of Health Grant MIG Municipal Inf rasture Grant NDG Neighbourhood Development Grant OPEX Operational Expenditure SOCIAL GRANT Department Of Social Grant SDM DITP, 2008 to 2013 180 31 Aug 2010
ROADS & STORMWATER FLAGSHIP PROJECTS (R60 million) Suburb Street From To Width Length Area(m²) Tariff Cost Cumulative (R) (R) (R) Bophelong Bokwe Mathews Dube 5.5 800 4400 550 2,420,000.00 2,420,000.00 Bophelong Mqhay i Bokwe Dube 5.5 330 1815 550 998,250.00 3,418,250.00 Bophelong Thema Mosaka Mathews 5.5 370 2035 550 1,<strong>11</strong>9,250.00 4,537,500.00 Bophelong Vilikazi Mathews Mohay i 5.5 770 4235 750 3,176,250.00 7,713,750.00 Bophelong Mosaka Plaatje Thema 5.5 160 880 704 619,520.00 8,333,270.00 Boipatong Malebogo Dr Nkomo Leshoboro 5 660 3300 550 1,815,000.00 10,148,270.00 Boipatong Moshoeshoe Thembu Tar Begin 5.5 100 550 <strong>11</strong>72 644,600.00 10,792,870.00 Boipatong Thembu Amatola Moshoshoe 5.5 560 3080 550 1,694,000.00 12,486,870.00 Raporoko Ext 5.5 920 5060 550 2,783,000.00 15,269,870.00 Sharpv ille Nkomo Mbata Sharpv ille Sanuku Oliphant Dubula 5.5 350 1925 550 1,058,750.00 16,328,620.00 Sharpv ille Hulwana Already tarrred. No kerbing and stormwater 16,328,620.00 Sharpv ille Mbatha Khabashane Hulwana 5.5 665 3657.5 550 2,0<strong>11</strong>,625.00 18,340,245.00 Sebokeng Rathebe Phuthatswana Hlalef ang 5.5 760 4180 550 2,299,000.00 20,639,245.00 Sebokeng Mohale Lerothodi Bonatla 5.5 660 3630 550 1,996,500.00 22,635,745.00 Sebokeng Mampoi Motebang Mabele 5.5 870 4785 550 2,631,750.00 25,267,495.00 Sebokeng Road 23 Bonatla Road 8 5.5 460 2530 550 1,391,500.00 26,658,995.00 Sebokeng Road F Road B Road I 5.5 530 2915 550 1,603,250.00 28,262,245.00 Sebokeng Road A Road 5 Road 7 5.5 500 2750 550 1,512,500.00 29,774,745.00 Ev aton Kent Lombard Mbatha West 6 360 2160 550 1,188,000.00 30,962,745.00 Sebkeng x15 Main rd K<strong>11</strong> Main rd 6.2 1580 9796 550 5,387,800.00 36,350,545.00 Hendrik V Eck End of Road 6 330 1980 550 1,089,000.00 37,439,545.00 SE.10 Suncrest Road Palm Springs Hawk Eagle Rd Eagle Rd 5.5 800 4400 550 2,420,000.00 39,859,545.00 Sebokeng Ladzidze Mopeli Sebe 5.5 420 2310 550 1,270,500.00 41,130,045.00 Sebokeng Maqoma Mopeli Sebe 5.5 420 2310 550 1,270,500.00 42,400,545.00 Boipatong Dr Nkomo Leshoboro Tar Begin 5.5 660 3300 550 1,815,000.00 44,215,545.00 Boipatong Mamelodi Tar Begin Dr Nkomo 5.5 160 880 704 619,520.00 44,835,065.00 Rust Ter Madelief ie Seder Pansy 5.5 360 1980 550 1,089,000.00 45,924,065.00 Rust Ter Vaal Krisant Narcissus Sonneblom 5.5 150 825 550 453,750.00 46,377,815.00 Rust Ter Vaal Krisant Ext (Sonneblom) Krisant Tulip 5.5 500 2750 550 1,512,500.00 47,890,315.00 Sebokeng Rathebe Hlalef ang Lekupe 5.5 350 1925 550 1,058,750.00 48,949,065.00 SDM DITP, 2008 to 2013 181 31 Aug 2010
- Page 1 and 2:
SedibengDistrictMun icipality DISTR
- Page 3 and 4:
Proposed Interventions / Programmes
- Page 5 and 6:
Transport Element Proposed Interven
- Page 7 and 8:
4.3.1 Existing Gauteng Rail Netw or
- Page 9 and 10:
11 FREIGHT TRANSPORT 155 11.1 Backg
- Page 11 and 12:
FIGURES Figure 1.1 Figure 1.2 Figur
- Page 13 and 14:
DRAWINGS / MAPS (Included on CD acc
- Page 15 and 16:
1 INTRODUCTION 1.1 Interrelationshi
- Page 17 and 18:
• The Operating Licences Strategy
- Page 19 and 20:
Figure 1.3: Gauteng and SDM Jurisdi
- Page 21 and 22:
1.3 Institutional Overview FIGURE 1
- Page 23 and 24:
1.4 Intergovernmental Relations The
- Page 25 and 26:
2 LEGISLATIVE FRAMEWORK FOR TRANSPO
- Page 27 and 28:
(e) Road Traffic Act, 1989 (Act 20
- Page 29 and 30:
(j) Development Facilitation Act, 1
- Page 31 and 32:
• provide for the necessary land
- Page 33 and 34:
• Undertaking functions relating
- Page 35 and 36:
infrastructure, thereby reducing ov
- Page 37 and 38:
FIGURE 3.1 provides the organogram
- Page 39 and 40:
• Integrated Transport Systems;
- Page 41 and 42:
Table 3.1: Transport Objectives for
- Page 43 and 44:
Table 4.1: Employment Status Region
- Page 45 and 46:
Purpose of Trip Other Bicycle Walk
- Page 47 and 48:
The graph below shows the average p
- Page 49 and 50:
Table 4.4: Dwelling Units Name City
- Page 51 and 52:
4.2.3 Employment Status of Economic
- Page 53 and 54:
4.2.4 Employment (by Place of Work)
- Page 55 and 56:
Table 4.8: Informal Workers by Muni
- Page 57 and 58:
Table 4.9: Unemployed by Municipal
- Page 59 and 60:
Figure 4.3: Schematic Illustration
- Page 61 and 62:
Table 4.11: Rail Operational Perfor
- Page 63 and 64:
Figure 4.5: Percentage of Passenger
- Page 65 and 66:
4.3.4 Assetsand Performance The Spo
- Page 67 and 68:
4.3.5 Revenue Sources TABLE 4.15 li
- Page 69 and 70:
Table 4.21: Number of Buses and Pas
- Page 71 and 72:
Table 4.24: Currnet Taxi Passenger
- Page 73 and 74:
5 STAKEHOLDER PARTICIPATION AND TRA
- Page 75 and 76:
Focus Areas Issue Raised Rail Opera
- Page 77 and 78:
6 SPATIAL PLANNING / LAND USE 6.1 S
- Page 79 and 80:
6.1.2 Midvaal The MidvaalLocalMunic
- Page 81 and 82:
• Lethabong x01 (Quaggasfontein)
- Page 83 and 84:
0 - 5 year commercial and industria
- Page 85 and 86:
SDM DITP, 2008 to 2013 71 31 Aug 20
- Page 87 and 88:
SDM DITP, 2008 to 2013 73 31 Aug 20
- Page 89 and 90:
SDM DITP, 2008 to 2013 75 31 Aug 20
- Page 91 and 92:
6.3.2 Creation of a Government and
- Page 93 and 94:
SDM DITP, 2008 to 2013 79 31 Aug 20
- Page 95 and 96:
SDM DITP, 2008 to 2013 81 31 Aug 20
- Page 97 and 98:
SDM DITP, 2008 to 2013 83 31 Aug 20
- Page 99 and 100:
• emphasis on the development of
- Page 101 and 102:
Figure 6.10 SDM DITP, 2008 to 2013
- Page 103 and 104:
The key issues identified through t
- Page 105 and 106:
In the southern parts of the study
- Page 107 and 108:
SDM DITP, 2008 to 2013 93 31 Aug 20
- Page 109 and 110:
7 DEV ELOPMENT CORRIDORS This chapt
- Page 111 and 112:
Corridor and surroundings. This w o
- Page 113 and 114:
7.1.3 Rail Network The Midvaal area
- Page 115 and 116:
• The secondary road network arou
- Page 117 and 118:
• The R558, an east-w est link be
- Page 119 and 120:
7.2.5 Framework Principles The foll
- Page 121 and 122:
Figure 7.3 SDM DITP, 2008 to 2013 1
- Page 123 and 124:
• The north-south running PWV19 w
- Page 125 and 126:
concerned, the Housing Master Plan
- Page 127 and 128:
7.3.6 Corridor and Nodal Developmen
- Page 129 and 130:
8 PUBLIC TRANSPORT PLAN This chapte
- Page 131 and 132:
• majority of operations are in E
- Page 133 and 134:
Table 8.1: Categorisation of Existi
- Page 135 and 136:
Figure 8.2: Proposed Gauteng Rail C
- Page 137 and 138:
• Monitoring and Evaluation: It w
- Page 139 and 140:
The future role of metered taxis an
- Page 141 and 142:
The creation of barrier-free enviro
- Page 143 and 144: Each of these examples has advantag
- Page 145 and 146: • Business Model, i.e. empow erme
- Page 147 and 148: • Road lighting: There are still
- Page 149 and 150: SDM w ill fund safety campaigns and
- Page 151 and 152: • keeping of records of all activ
- Page 153 and 154: • Statistics. (d) Outputs SDM w i
- Page 155 and 156: SDM w ill assist its Local Municipa
- Page 157 and 158: None Type Routine Reseal Light Reha
- Page 159 and 160: 10 AIRPORTS 10.1 Background 10.1.1
- Page 161 and 162: Figure 10.1: Airports Location and
- Page 163 and 164: (b) Heidelberg Airfield Heidelberg
- Page 165 and 166: midfield area and its attendant acc
- Page 167 and 168: (e) WonderboomAirport, Tshw ane Won
- Page 169 and 170: 11 FREIGHT TRANSPORT 11.1 Backgroun
- Page 171 and 172: Source:Gauteng Overload Control Str
- Page 173 and 174: Source:Gauteng Overload Control Str
- Page 175 and 176: Management and Operations:The Overl
- Page 177 and 178: also developed standard specificati
- Page 179 and 180: Table 11.3: Five-Point Intervention
- Page 181 and 182: Activity Areas: There are three pro
- Page 183 and 184: • Undertake an assessment of frei
- Page 185 and 186: • Pedestrian Safety: There is a l
- Page 187 and 188: 13 WATERWAYS PLAN 13.1 Background R
- Page 189 and 190: • On inland w aters a vessel may
- Page 191 and 192: Description Upgrading of sew er and
- Page 193: R&S-32 R&S-34 R&S-36 R&S-475 R&S-47
- Page 197 and 198: Unfunded Projects for 2009/10 Code
- Page 199 and 200: Unfunded Projects for 2009/10 Code
- Page 201 and 202: Unfunded Projects for 2009/10 Code
- Page 203 and 204: Unfunded Projects for 2009/10 Code
- Page 205 and 206: Unfunded Projects for 2009/10 Code
- Page 207 and 208: Unfunded Projects for 2009/10 Code
- Page 209 and 210: Unfunded Projects for 2009/10 Code
- Page 211 and 212: Unfunded Projects for 2009/10 Code
- Page 213 and 214: 14.2.2 Midvaal The table below cont
- Page 215 and 216: 14.2.3 Lesedi The table below conta
- Page 217 and 218: 15 TRANSPORT MONITORING AND KEY PER
- Page 219 and 220: Key Policy Area Promotion of access
- Page 221 and 222: Key Strategy Area Freight transport
- Page 223 and 224: 15.2 Problem Statement It is approp
- Page 225 and 226: Distinction w ill be made betw een:
- Page 227 and 228: • to promote co-operative governa
- Page 229 and 230: • Engineering Services Contributi
- Page 231 and 232: 17 IMPLEMENTATION OF ITP 17.1 Resou
- Page 233 and 234: Transport Element 4 Transport Infra
- Page 235 and 236: Transport Element Proposed Interven