Chapter 11 - Sedibeng District Municipality
Chapter 11 - Sedibeng District Municipality
Chapter 11 - Sedibeng District Municipality

Create successful ePaper yourself
Turn your PDF publications into a flip-book with our unique Google optimized e-Paper software.
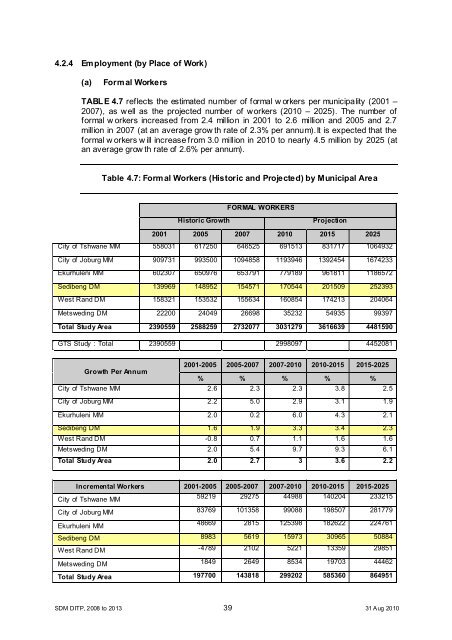
4.2.4 Employment (by Place of Work)<br />
(a)<br />
Formal Workers<br />
TABLE 4.7 reflects the estimated number of formal w orkers per municipality (2001 –<br />
2007), as well as the projected number of workers (2010 – 2025). The number of<br />
formal w orkers increased from 2.4 million in 2001 to 2.6 million and 2005 and 2.7<br />
million in 2007 (at an average grow th rate of 2.3% per annum).It is expected that the<br />
formal w orkers w ill increase from 3.0 million in 2010 to nearly 4.5 million by 2025 (at<br />
an average grow th rate of 2.6% per annum).<br />
Table 4.7: Formal Workers (Historic and Projected) by Municipal Area<br />
FORMAL WORKERS<br />
Historic Growth<br />
Projection<br />
2001 2005 2007 2010 2015 2025<br />
City of Tshwane MM 558031 617250 646525 691513 831717 1064932<br />
City of Joburg MM 909731 993500 1094858 <strong>11</strong>93946 1392454 1674233<br />
Ekurhuleni MM 602307 650976 653791 779189 9618<strong>11</strong> <strong>11</strong>86572<br />
<strong>Sedibeng</strong> DM 139969 148952 154571 170544 201509 252393<br />
West Rand DM 158321 153532 155634 160854 174213 204064<br />
Metsweding DM 22200 24049 26698 35232 54935 99397<br />
Total Study Area 2390559 2588259 2732077 3031279 3616639 4481590<br />
GTS Study : Total 2390559 2998097 4452081<br />
2001-2005 2005-2007 2007-2010 2010-2015 2015-2025<br />
Growth Per Annum<br />
% % % % %<br />
City of Tshwane MM 2.6 2.3 2.3 3.8 2.5<br />
City of Joburg MM 2.2 5.0 2.9 3.1 1.9<br />
Ekurhuleni MM 2.0 0.2 6.0 4.3 2.1<br />
<strong>Sedibeng</strong> DM 1.6 1.9 3.3 3.4 2.3<br />
West Rand DM -0.8 0.7 1.1 1.6 1.6<br />
Metsweding DM 2.0 5.4 9.7 9.3 6.1<br />
Total Study Area 2.0 2.7 3 3.6 2.2<br />
Incremental Workers 2001-2005 2005-2007 2007-2010 2010-2015 2015-2025<br />
City of Tshwane MM<br />
59219 29275 44988 140204 233215<br />
City of Joburg MM 83769 101358 99088 198507 281779<br />
Ekurhuleni MM<br />
48669 2815 125398 182622 224761<br />
<strong>Sedibeng</strong> DM 8983 5619 15973 30965 50884<br />
West Rand DM -4789 2102 5221 13359 29851<br />
Metsweding DM 1849 2649 8534 19703 44462<br />
Total Study Area 197700 143818 299202 585360 864951<br />
SDM DITP, 2008 to 2013 39 31 Aug 2010