Chapter 11 - Sedibeng District Municipality
Chapter 11 - Sedibeng District Municipality
Chapter 11 - Sedibeng District Municipality

You also want an ePaper? Increase the reach of your titles
YUMPU automatically turns print PDFs into web optimized ePapers that Google loves.
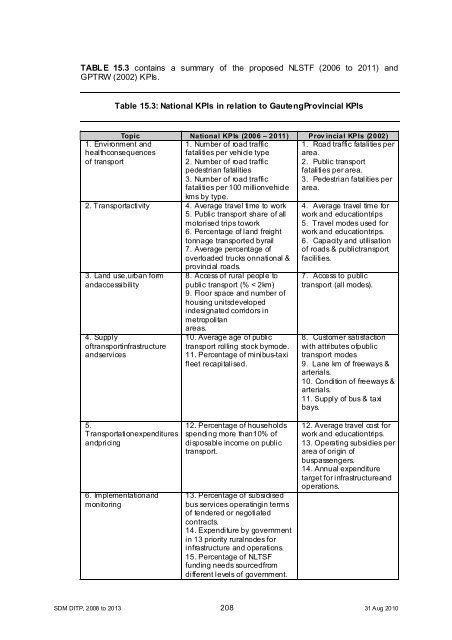
TABLE 15.3 contains a summary of the proposed NLSTF (2006 to 20<strong>11</strong>) and<br />
GPTRW (2002) KPIs.<br />
Table 15.3: National KPIs in relation to GautengProvincial KPIs<br />
Topic National KPIs (2006 – 20<strong>11</strong>) Prov incial KPIs (2002)<br />
1. Number of road traffic 1. Road traffic fatalities per<br />
fatalities per vehicle type area.<br />
2. Number of road traffic 2. Public transport<br />
pedestrian fatalities<br />
fatalities per area.<br />
3. Number of road traffic 3. Pedestrian fatalities per<br />
fatalities per 100 millionvehicle area.<br />
kms by type.<br />
1. Environment and<br />
healthconsequences<br />
of transport<br />
2. Transportactivity 4. Average travel time to work<br />
5. Public transport share of all<br />
motorised trips towork<br />
6. Percentage of land freight<br />
tonnage transported byrail<br />
7. Average percentage of<br />
overloaded trucks onnational &<br />
provincial roads.<br />
3. Land use,urban form<br />
andaccessibility<br />
4. Supply<br />
oftransportinfrastructure<br />
andservices<br />
8. Access of rural people to<br />
public transport (% < 2km)<br />
9. Floor space and number of<br />
housing unitsdeveloped<br />
indesignated corridors in<br />
metropolitan<br />
areas.<br />
10. Average age of public<br />
transport rolling stock bymode.<br />
<strong>11</strong>. Percentage of minibus-taxi<br />
fleet recapitalised.<br />
4. Average travel time for<br />
work and educationtrips<br />
5. Travel modes used for<br />
work and educationtrips.<br />
6. Capacity and utilisation<br />
of roads & publictransport<br />
facilities.<br />
7. Access to public<br />
transport (all modes).<br />
8. Customer satisfaction<br />
with attributes ofpublic<br />
transport modes<br />
9. Lane km of freeways &<br />
arterials.<br />
10. Condition of freeways &<br />
arterials.<br />
<strong>11</strong>. Supply of bus & taxi<br />
bays.<br />
5.<br />
Transportationexpenditures<br />
andpricing<br />
6. Implementationand<br />
monitoring<br />
12. Percentage of households<br />
spending more than10% of<br />
disposable income on public<br />
transport.<br />
13. Percentage of subsidised<br />
bus services operatingin terms<br />
of tendered or negotiated<br />
contracts.<br />
14. Expenditure by government<br />
in 13 priority ruralnodes for<br />
infrastructure and operations.<br />
15. Percentage of NLTSF<br />
funding needs sourcedfrom<br />
different levels of government.<br />
12. Average travel cost for<br />
work and educationtrips.<br />
13. Operating subsidies per<br />
area of origin of<br />
buspassengers.<br />
14. Annual expenditure<br />
target for infrastructureand<br />
operations.<br />
SDM DITP, 2008 to 2013 208 31 Aug 2010