Chapter 11 - Sedibeng District Municipality
Chapter 11 - Sedibeng District Municipality
Chapter 11 - Sedibeng District Municipality

Create successful ePaper yourself
Turn your PDF publications into a flip-book with our unique Google optimized e-Paper software.
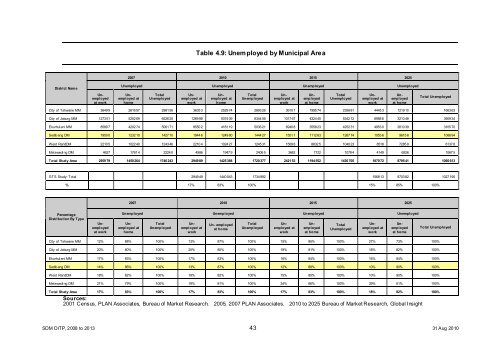
Table 4.9: Unemployed by Municipal Area<br />
<strong>District</strong> Name<br />
Unemployed<br />
at work<br />
2007 2010 2015 2025<br />
Unemployed Unemployed Unemployed Unemployed<br />
Unemployed<br />
at<br />
home<br />
Total<br />
Unemployed<br />
Unemployed<br />
at<br />
work<br />
Unemployed<br />
at<br />
home<br />
Total<br />
Unemployed<br />
Unemployed<br />
at<br />
work<br />
Unemployed<br />
at home<br />
Total<br />
Unemployed<br />
Unemployed<br />
at<br />
work<br />
Unemployed<br />
at home<br />
Total Unemployed<br />
City of Tshwane MM 36499 261657 298156 36353 252974 289326 36107 199574 235681 44453 121910 166363<br />
City of Joburg MM 127351 525269 652620 126998 507409 634406 101767 432445 534212 69886 321048 390934<br />
Ekurhuleni MM 85897 420274 506171 85502 418<strong>11</strong>9 503621 69408 355823 425231 49530 261039 310570<br />
<strong>Sedibeng</strong> DM 19500 123210 142710 19446 124980 144427 155<strong>11</strong> <strong>11</strong>1263 126774 10536 96158 106694<br />
West RandDM 22105 102240 124346 22104 102427 124531 15698 88325 104023 8518 72859 81378<br />
Metsweding DM 4627 17614 22240 4586 19479 24065 3662 7122 10784 4149 6526 10675<br />
Total Study Area 295979 1450264 1746243 294989 1425388 1720377 242153 <strong>11</strong>94552 1436705 187072 879541 1066613<br />
GTS Study: Total 294949 1440043 1734992 156813 870382 1027195<br />
% 17% 83% 100% 15% 85% 100%<br />
2007 2010 2015 2025<br />
Percentage<br />
Distribution By Type<br />
Unemployed<br />
at work<br />
Unemployed Unemployed Unemployed Unemployed<br />
Unemployed<br />
at<br />
home<br />
Total<br />
Unemployed<br />
Unemployed<br />
at<br />
work<br />
Un- employed<br />
at home<br />
Total<br />
Unemployed<br />
Unemployed<br />
at<br />
work<br />
Unemployed<br />
at home<br />
Total<br />
Unemployed<br />
Unemployed<br />
at<br />
work<br />
Unemployed<br />
at home<br />
Total Unemployed<br />
City of Tshwane MM 12% 88% 100% 13% 87% 100% 15% 85% 100% 27% 73% 100%<br />
City of Joburg MM 20% 80% 100% 20% 80% 100% 19% 81% 100% 18% 82% 100%<br />
Ekurhuleni MM 17% 83% 100% 17% 83% 100% 16% 84% 100% 16% 84% 100%<br />
<strong>Sedibeng</strong> DM 14% 86% 100% 13% 87% 100% 12% 88% 100% 10% 90% 100%<br />
West RandDM 18% 82% 100% 18% 82% 100% 15% 85% 100% 10% 90% 100%<br />
Metsweding DM 21% 79% 100% 19% 81% 100% 34% 66% 100% 39% 61% 100%<br />
Total Study Area 17% 83% 100% 17% 83% 100% 17% 83% 100% 18% 82% 100%<br />
Sources:<br />
2001 Census, PLAN Associates, Bureau of Market Research. 2005, 2007 PLAN Associates. 2010 to 2025 Bureau of Market Research, Global Insight<br />
SDM DITP, 2008 to 2013 43 31 Aug 2010