Chapter 11 - Sedibeng District Municipality
Chapter 11 - Sedibeng District Municipality
Chapter 11 - Sedibeng District Municipality

Create successful ePaper yourself
Turn your PDF publications into a flip-book with our unique Google optimized e-Paper software.
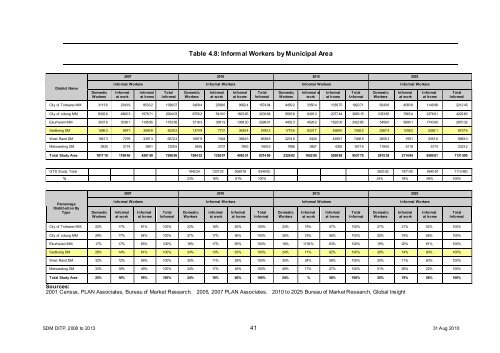
Table 4.8: Informal Workers by Municipal Area<br />
2007 2010 2015 2025<br />
<strong>District</strong> Name<br />
Domestic<br />
Workers<br />
Informal Workers Informal Workers Informal Workers Informal Workers<br />
Informal<br />
at work<br />
Informal<br />
at home<br />
Total<br />
Informal<br />
Domestic<br />
Workers<br />
Informal<br />
at work<br />
Informal<br />
at home<br />
Total<br />
Informal<br />
Domestic<br />
Workers<br />
Informal at<br />
work<br />
Informal<br />
at home<br />
Total<br />
Informal<br />
Domestic<br />
Workers<br />
Informal<br />
at work<br />
Informal<br />
at home<br />
Total<br />
Informal<br />
City of Tshwane MM 3<strong>11</strong>36 23439 85332 139907 34584 25986 96924 157494 44592 33504 103975 182071 60408 45838 <strong>11</strong>4998 221245<br />
City of Joburg MM 83928 48603 157871 290403 87502 54100 182366 323968 95638 64933 207744 368315 105385 79634 237661 422680<br />
Ekurhuleni MM 30379 30381 <strong>11</strong>4595 175356 37163 35819 136820 209801 44523 45262 152500 242285 54580 58061 174390 287032<br />
<strong>Sedibeng</strong> DM 12863 6971 30468 50302 13749 7731 36354 57833 17195 93377 43690 70262 22674 12082 52821 87576<br />
West Rand DM 19473 7278 33973 60724 19979 7464 38945 66388 22748 8320 43597 74665 26553 9761 53516 89830<br />
Metsweding DM 3930 2174 5901 12005 5455 2707 7843 16005 7986 3807 4383 16176 <strong>11</strong>940 6<strong>11</strong>8 5174 23232<br />
Total Study Area 181710 <strong>11</strong>8846 428140 728696 198432 133807 499251 831489 232682 165205 555888 953775 281539 2<strong>11</strong>494 638561 <strong>11</strong>31595<br />
GTS Study: Total 194224 133703 506978 834905 262302 197100 654081 <strong>11</strong>13483<br />
% 23% 16% 61% 100% 24% 18% 59% 100%<br />
2007 2010 2015 2025<br />
Percentage<br />
Distribution By<br />
Type<br />
Domestic<br />
Workers<br />
Informal Workers Informal Workers Informal Workers Informal Workers<br />
Informal<br />
at work<br />
Informal<br />
at home<br />
Total<br />
Informal<br />
Domestic<br />
Workers<br />
Informal<br />
at work<br />
Informal<br />
at home<br />
Total<br />
Informal<br />
Domestic<br />
Workers<br />
Informal<br />
at work<br />
Informal<br />
at home<br />
Total<br />
Informal<br />
Domestic<br />
Workers<br />
Informal<br />
at work<br />
Informal<br />
at home<br />
Total<br />
Informal<br />
City of Tshwane MM 22% 17% 61% 100% 22% 16% 62% 100% 24% 18% 57% 100% 27% 21% 52% 100%<br />
City of Joburg MM 29% 17% 54% 100% 27% 17% 56% 100% 26% 18% 56% 100% 25% 19% 56% 100%<br />
Ekurhuleni MM 17% 17% 65% 100% 18% 17% 65% 100% 18% <strong>11</strong>39% 63% 100% 19% 20% 61% 100%<br />
<strong>Sedibeng</strong> DM 26% 14% 61% 100% 24% 13% 63% 100% 24% <strong>11</strong>% 62% 100% 26% 14% 60% 100%<br />
West Rand DM 32% 12% 56% 100% 30% <strong>11</strong>% 59% 100% 30% 24% 58% 100% 30% <strong>11</strong>% 60% 100%<br />
Metsweding DM 33% 18% 49% 100% 34% 17% 49% 100% 49% 17% 27% 100% 51% 26% 22% 100%<br />
Total Study Area 25% 16% 59% 100% 24% 16% 60% 100% 24% % 58% 100% 25% 19% 56% 100%<br />
Sources:<br />
2001 Census, PLAN Associates, Bureau of Market Research. 2005, 2007 PLAN Associates. 2010 to 2025 Bureau of Market Research, Global Insight<br />
SDM DITP, 2008 to 2013 41 31 Aug 2010