- Page 1 and 2:
SedibengDistrictMun icipality DISTR
- Page 3 and 4: Proposed Interventions / Programmes
- Page 5 and 6: Transport Element Proposed Interven
- Page 7 and 8: 4.3.1 Existing Gauteng Rail Netw or
- Page 9 and 10: 11 FREIGHT TRANSPORT 155 11.1 Backg
- Page 11 and 12: FIGURES Figure 1.1 Figure 1.2 Figur
- Page 13 and 14: DRAWINGS / MAPS (Included on CD acc
- Page 15 and 16: 1 INTRODUCTION 1.1 Interrelationshi
- Page 17 and 18: • The Operating Licences Strategy
- Page 19 and 20: Figure 1.3: Gauteng and SDM Jurisdi
- Page 21 and 22: 1.3 Institutional Overview FIGURE 1
- Page 23 and 24: 1.4 Intergovernmental Relations The
- Page 25 and 26: 2 LEGISLATIVE FRAMEWORK FOR TRANSPO
- Page 27 and 28: (e) Road Traffic Act, 1989 (Act 20
- Page 29 and 30: (j) Development Facilitation Act, 1
- Page 31 and 32: • provide for the necessary land
- Page 33 and 34: • Undertaking functions relating
- Page 35 and 36: infrastructure, thereby reducing ov
- Page 37 and 38: FIGURE 3.1 provides the organogram
- Page 39 and 40: • Integrated Transport Systems;
- Page 41 and 42: Table 3.1: Transport Objectives for
- Page 43 and 44: Table 4.1: Employment Status Region
- Page 45 and 46: Purpose of Trip Other Bicycle Walk
- Page 47 and 48: The graph below shows the average p
- Page 49 and 50: Table 4.4: Dwelling Units Name City
- Page 51 and 52: 4.2.3 Employment Status of Economic
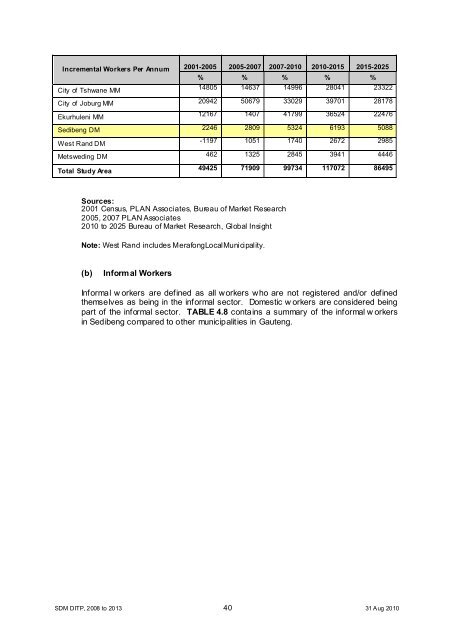
- Page 53: 4.2.4 Employment (by Place of Work)
- Page 57 and 58: Table 4.9: Unemployed by Municipal
- Page 59 and 60: Figure 4.3: Schematic Illustration
- Page 61 and 62: Table 4.11: Rail Operational Perfor
- Page 63 and 64: Figure 4.5: Percentage of Passenger
- Page 65 and 66: 4.3.4 Assetsand Performance The Spo
- Page 67 and 68: 4.3.5 Revenue Sources TABLE 4.15 li
- Page 69 and 70: Table 4.21: Number of Buses and Pas
- Page 71 and 72: Table 4.24: Currnet Taxi Passenger
- Page 73 and 74: 5 STAKEHOLDER PARTICIPATION AND TRA
- Page 75 and 76: Focus Areas Issue Raised Rail Opera
- Page 77 and 78: 6 SPATIAL PLANNING / LAND USE 6.1 S
- Page 79 and 80: 6.1.2 Midvaal The MidvaalLocalMunic
- Page 81 and 82: • Lethabong x01 (Quaggasfontein)
- Page 83 and 84: 0 - 5 year commercial and industria
- Page 85 and 86: SDM DITP, 2008 to 2013 71 31 Aug 20
- Page 87 and 88: SDM DITP, 2008 to 2013 73 31 Aug 20
- Page 89 and 90: SDM DITP, 2008 to 2013 75 31 Aug 20
- Page 91 and 92: 6.3.2 Creation of a Government and
- Page 93 and 94: SDM DITP, 2008 to 2013 79 31 Aug 20
- Page 95 and 96: SDM DITP, 2008 to 2013 81 31 Aug 20
- Page 97 and 98: SDM DITP, 2008 to 2013 83 31 Aug 20
- Page 99 and 100: • emphasis on the development of
- Page 101 and 102: Figure 6.10 SDM DITP, 2008 to 2013
- Page 103 and 104: The key issues identified through t
- Page 105 and 106:
In the southern parts of the study
- Page 107 and 108:
SDM DITP, 2008 to 2013 93 31 Aug 20
- Page 109 and 110:
7 DEV ELOPMENT CORRIDORS This chapt
- Page 111 and 112:
Corridor and surroundings. This w o
- Page 113 and 114:
7.1.3 Rail Network The Midvaal area
- Page 115 and 116:
• The secondary road network arou
- Page 117 and 118:
• The R558, an east-w est link be
- Page 119 and 120:
7.2.5 Framework Principles The foll
- Page 121 and 122:
Figure 7.3 SDM DITP, 2008 to 2013 1
- Page 123 and 124:
• The north-south running PWV19 w
- Page 125 and 126:
concerned, the Housing Master Plan
- Page 127 and 128:
7.3.6 Corridor and Nodal Developmen
- Page 129 and 130:
8 PUBLIC TRANSPORT PLAN This chapte
- Page 131 and 132:
• majority of operations are in E
- Page 133 and 134:
Table 8.1: Categorisation of Existi
- Page 135 and 136:
Figure 8.2: Proposed Gauteng Rail C
- Page 137 and 138:
• Monitoring and Evaluation: It w
- Page 139 and 140:
The future role of metered taxis an
- Page 141 and 142:
The creation of barrier-free enviro
- Page 143 and 144:
Each of these examples has advantag
- Page 145 and 146:
• Business Model, i.e. empow erme
- Page 147 and 148:
• Road lighting: There are still
- Page 149 and 150:
SDM w ill fund safety campaigns and
- Page 151 and 152:
• keeping of records of all activ
- Page 153 and 154:
• Statistics. (d) Outputs SDM w i
- Page 155 and 156:
SDM w ill assist its Local Municipa
- Page 157 and 158:
None Type Routine Reseal Light Reha
- Page 159 and 160:
10 AIRPORTS 10.1 Background 10.1.1
- Page 161 and 162:
Figure 10.1: Airports Location and
- Page 163 and 164:
(b) Heidelberg Airfield Heidelberg
- Page 165 and 166:
midfield area and its attendant acc
- Page 167 and 168:
(e) WonderboomAirport, Tshw ane Won
- Page 169 and 170:
11 FREIGHT TRANSPORT 11.1 Backgroun
- Page 171 and 172:
Source:Gauteng Overload Control Str
- Page 173 and 174:
Source:Gauteng Overload Control Str
- Page 175 and 176:
Management and Operations:The Overl
- Page 177 and 178:
also developed standard specificati
- Page 179 and 180:
Table 11.3: Five-Point Intervention
- Page 181 and 182:
Activity Areas: There are three pro
- Page 183 and 184:
• Undertake an assessment of frei
- Page 185 and 186:
• Pedestrian Safety: There is a l
- Page 187 and 188:
13 WATERWAYS PLAN 13.1 Background R
- Page 189 and 190:
• On inland w aters a vessel may
- Page 191 and 192:
Description Upgrading of sew er and
- Page 193 and 194:
R&S-32 R&S-34 R&S-36 R&S-475 R&S-47
- Page 195 and 196:
ROADS & STORMWATER FLAGSHIP PROJECT
- Page 197 and 198:
Unfunded Projects for 2009/10 Code
- Page 199 and 200:
Unfunded Projects for 2009/10 Code
- Page 201 and 202:
Unfunded Projects for 2009/10 Code
- Page 203 and 204:
Unfunded Projects for 2009/10 Code
- Page 205 and 206:
Unfunded Projects for 2009/10 Code
- Page 207 and 208:
Unfunded Projects for 2009/10 Code
- Page 209 and 210:
Unfunded Projects for 2009/10 Code
- Page 211 and 212:
Unfunded Projects for 2009/10 Code
- Page 213 and 214:
14.2.2 Midvaal The table below cont
- Page 215 and 216:
14.2.3 Lesedi The table below conta
- Page 217 and 218:
15 TRANSPORT MONITORING AND KEY PER
- Page 219 and 220:
Key Policy Area Promotion of access
- Page 221 and 222:
Key Strategy Area Freight transport
- Page 223 and 224:
15.2 Problem Statement It is approp
- Page 225 and 226:
Distinction w ill be made betw een:
- Page 227 and 228:
• to promote co-operative governa
- Page 229 and 230:
• Engineering Services Contributi
- Page 231 and 232:
17 IMPLEMENTATION OF ITP 17.1 Resou
- Page 233 and 234:
Transport Element 4 Transport Infra
- Page 235 and 236:
Transport Element Proposed Interven