Chapter 11 - Sedibeng District Municipality
Chapter 11 - Sedibeng District Municipality
Chapter 11 - Sedibeng District Municipality

You also want an ePaper? Increase the reach of your titles
YUMPU automatically turns print PDFs into web optimized ePapers that Google loves.
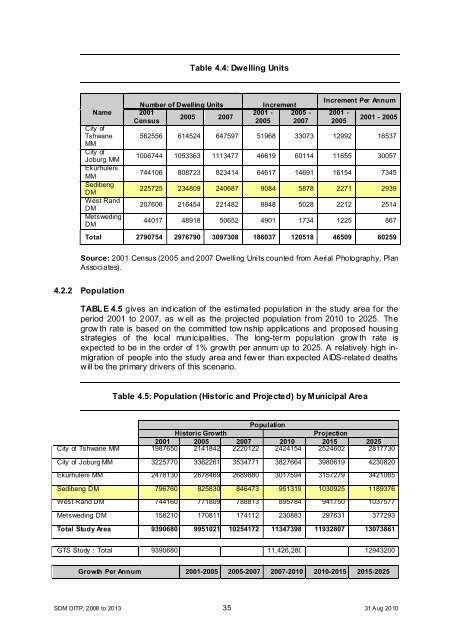
Table 4.4: Dwelling Units<br />
Name<br />
City of<br />
Tshwane<br />
MM<br />
City of<br />
Joburg MM<br />
Ekurhuleni<br />
MM<br />
<strong>Sedibeng</strong><br />
DM<br />
West Rand<br />
DM<br />
Metsweding<br />
DM<br />
Number of Dwelling Units<br />
2001<br />
2005 2007<br />
Census<br />
2001 -<br />
2005<br />
Increment<br />
2005 -<br />
2007<br />
Increment Per Annum<br />
2001 -<br />
2005<br />
2001 - 2005<br />
562556 614524 647597 51968 33073 12992 16537<br />
1006744 1053363 <strong>11</strong>13477 46619 60<strong>11</strong>4 <strong>11</strong>655 30057<br />
744106 808723 823414 64617 14691 16154 7345<br />
225725 234809 240687 9084 5878 2271 2939<br />
207606 216454 221482 8848 5028 2212 2514<br />
44017 48918 50652 4901 1734 1225 867<br />
Total 2790754 2976790 3097308 186037 120518 46509 60259<br />
Source: 2001 Census (2005 and 2007 Dwelling Units counted from Aerial Photography, Plan<br />
Associates).<br />
4.2.2 Population<br />
TABLE 4.5 gives an indication of the estimated population in the study area for the<br />
period 2001 to 2007, as w ell as the projected population from 2010 to 2025. The<br />
grow th rate is based on the committed tow nship applications and proposed housing<br />
strategies of the local municipalities. The long-term population grow th rate is<br />
expected to be in the order of 1% growth per annum up to 2025. A relatively high inmigration<br />
of people into the study area and fewer than expected AIDS-related deaths<br />
will be the primary drivers of this scenario.<br />
Table 4.5: Population (Historic and Projected) by Municipal Area<br />
Population<br />
Historic Growth<br />
Projection<br />
2001 2005 2007 2010 2015 2025<br />
City of Tshwane MM 1987650 2141842 2220122 2424154 2524602 2817730<br />
City of Joburg MM 3225770 3362261 3534771 3827664 3980619 4230820<br />
Ekurhuleni MM 2478130 2678469 2689880 3017594 3157279 3421065<br />
<strong>Sedibeng</strong> DM 796760 825830 846473 951319 1030925 <strong>11</strong>89376<br />
West Rand DM 744160 771809 788813 895784 941750 1037577<br />
Metsweding DM 158210 1708<strong>11</strong> 174<strong>11</strong>2 230883 297631 377293<br />
Total Study Area 9390680 9951021 10254172 <strong>11</strong>347398 <strong>11</strong>932807 13073861<br />
GTS Study : Total 9390680 <strong>11</strong>,426,280 12943200<br />
Growth Per Annum 2001-2005 2005-2007 2007-2010 2010-2015 2015-2025<br />
SDM DITP, 2008 to 2013 35 31 Aug 2010