- Page 1 and 2: City College of San Francisco 2006
- Page 3 and 4: CHANCELLOR'S PREFACE: THE MAKING OF
- Page 5 and 6: Certification of the Institutional
- Page 7 and 8: ELIGIBILITY REQUIREMENTS Authority
- Page 9 and 10: Financial Accountability Annual fin
- Page 11 and 12: TABLE OF CONTENTS Chancellor's Pref
- Page 13 and 14: HISTORY OF CITY COLLEGE As of 2005,
- Page 15 and 16: INTRODUCTION | HISTORY The outcome
- Page 17 and 18: ORGANIZATION OF THE INSTITUTION The
- Page 19 and 20: Director Human Resources Clara Star
- Page 21 and 22: Dean Admissions & Records (Credit)
- Page 23 and 24: CITY & COLLEGE DATA I. San Francisc
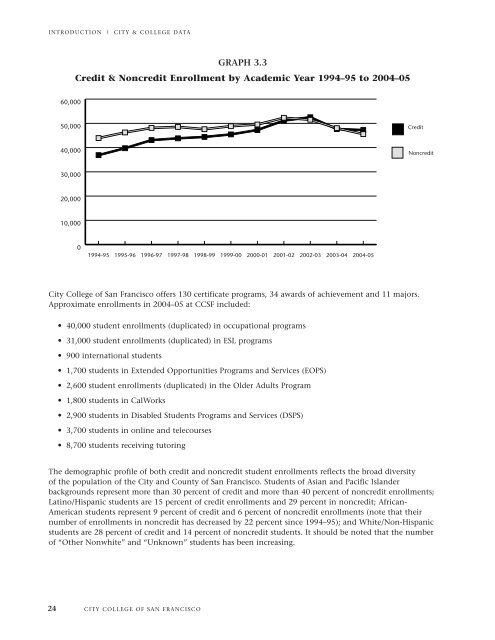
- Page 25 and 26: INTRODUCTION | CITY & COLLEGE DATA
- Page 27 and 28: INTRODUCTION | CITY & COLLEGE DATA
- Page 29 and 30: INTRODUCTION | CITY & COLLEGE DATA
- Page 31 and 32: INTRODUCTION | CITY & COLLEGE DATA
- Page 33: INTRODUCTION | CITY & COLLEGE DATA
- Page 37 and 38: INTRODUCTION | CITY & COLLEGE DATA
- Page 39 and 40: INTRODUCTION | CITY & COLLEGE DATA
- Page 41 and 42: INTRODUCTION | CITY & COLLEGE DATA
- Page 43 and 44: INTRODUCTION | CITY & COLLEGE DATA
- Page 45 and 46: INTRODUCTION | CITY & COLLEGE DATA
- Page 47 and 48: INTRODUCTION | CITY & COLLEGE DATA
- Page 49 and 50: INTRODUCTION | CITY & COLLEGE DATA
- Page 51 and 52: INTRODUCTION | CITY & COLLEGE DATA
- Page 53 and 54: INTRODUCTION | CITY & COLLEGE DATA
- Page 55 and 56: INTRODUCTION | CITY & COLLEGE DATA
- Page 57 and 58: INTRODUCTION | CITY & COLLEGE DATA
- Page 59 and 60: INTRODUCTION | CITY & COLLEGE DATA
- Page 61 and 62: INTRODUCTION | CITY & COLLEGE DATA
- Page 63 and 64: CCSF PRINCIPAL LOCATIONS MAP Identi
- Page 65 and 66: Standard I Susan Lopez Dr. Bruce Sm
- Page 67 and 68: PARTICIPANT LISTS Standard I Susan
- Page 69 and 70: INTRODUCTION | PARTICIPANTS Standar
- Page 71 and 72: INTRODUCTION | PARTICIPANTS Theme 3
- Page 73 and 74: READERS’ GUIDE TO THE CCSF ACCRED
- Page 75 and 76: ABSTRACT OF THE SELF STUDY Standard
- Page 77 and 78: INTRODUCTION | ABSTRACT development
- Page 79 and 80: INTRODUCTION | ABSTRACT Development
- Page 81 and 82: INTRODUCTION | ABSTRACT Standard II
- Page 83 and 84: INTRODUCTION | ABSTRACT Theme III:
- Page 85 and 86:
RESPONSE TO 2000 RECOMMENDATIONS
- Page 87 and 88:
2000 RESPONSE Over 70 percent agree
- Page 89 and 90:
2000 RESPONSE One of the services c
- Page 91 and 92:
2000 RESPONSE 2000 | Standard 3: In
- Page 93 and 94:
2000 RESPONSE 2000 | Standard 7: Fa
- Page 95 and 96:
2000 RESPONSE 2000 | Standard 10: G
- Page 97 and 98:
STANDARD I: Institutional Mission &
- Page 99 and 100:
STANDARD I II. Standards I.A & I.B
- Page 101 and 102:
STANDARD I objectives. In addition,
- Page 103 and 104:
STANDARD I Alemany Campuses offer e
- Page 105 and 106:
STANDARD I its effectiveness in mee
- Page 107 and 108:
STANDARD I IV. References Ref. 1 Re
- Page 109 and 110:
STANDARD II: Student Learning Progr
- Page 111 and 112:
STANDARD II.A I. Overview of the St
- Page 113 and 114:
STANDARD II.A program develops a se
- Page 115 and 116:
STANDARD II.A College Curriculum Co
- Page 117 and 118:
STANDARD II.A course content, and i
- Page 119 and 120:
STANDARD II.A The Intensive English
- Page 121 and 122:
STANDARD II.A Committee is the main
- Page 123 and 124:
STANDARD II.A some departments (e.g
- Page 125 and 126:
STANDARD II.A Most departments repo
- Page 127 and 128:
STANDARD II.A II.A.3.b. A capabilit
- Page 129 and 130:
STANDARD II.A Other institution-wid
- Page 131 and 132:
STANDARD II.A The Transfer Center p
- Page 133 and 134:
STANDARD II.A expounds the principl
- Page 135 and 136:
STANDARD II.A provide students with
- Page 137 and 138:
STANDARD II.A Ref. 26 Ref. 27 Ref.
- Page 139 and 140:
STANDARD II.B I. Overview of the St
- Page 141 and 142:
STANDARD II.B promotes departmental
- Page 143 and 144:
STANDARD II.B Many special programs
- Page 145 and 146:
STANDARD II.B Professional developm
- Page 147 and 148:
STANDARD II.B Students no longer ne
- Page 149 and 150:
STANDARD II.B III. Strengths & Area
- Page 151 and 152:
STANDARD II.B IV. References Ref. 1
- Page 153 and 154:
STANDARD II.C I. Overview of the St
- Page 155 and 156:
STANDARD II.C Resources building. C
- Page 157 and 158:
STANDARD II.C combined with qualita
- Page 159 and 160:
STANDARD II.C equipment line item t
- Page 161 and 162:
STANDARD II.C Moreover, annual stud
- Page 163 and 164:
STANDARD II.C 3. There is significa
- Page 165 and 166:
STANDARD III Resources
- Page 167 and 168:
REPORT TAB III.A III.A
- Page 169 and 170:
STANDARD III.A II. Standard III.A R
- Page 171 and 172:
STANDARD III.A indicators that are
- Page 173 and 174:
STANDARD III.A Slurs is included in
- Page 175 and 176:
STANDARD III.A Management Council m
- Page 177 and 178:
STANDARD III.A the California Commu
- Page 179 and 180:
STANDARD III.A III.A.4.c. The insti
- Page 181 and 182:
STANDARD III.A The Technology Learn
- Page 183 and 184:
STANDARD III.A III. Strengths & Are
- Page 185 and 186:
STANDARD III.A IV. References Ref.
- Page 187 and 188:
REPORT TAB III.B III.B
- Page 189 and 190:
STANDARD III.B While the 2001 bond
- Page 191 and 192:
STANDARD III.B The College actively
- Page 193 and 194:
STANDARD III.B In cooperation with
- Page 195 and 196:
STANDARD III.B III. Strengths & Are
- Page 197 and 198:
REPORT TAB III.C III.C
- Page 199 and 200:
STANDARD III.C II. Standard Report
- Page 201 and 202:
STANDARD III.C the Banner database
- Page 203 and 204:
STANDARD III.C In addition, the Col
- Page 205 and 206:
STANDARD III.C IV. References Ref.
- Page 207 and 208:
STANDARD III.D I. Overview of the S
- Page 209 and 210:
STANDARD III.D The College’s annu
- Page 211 and 212:
STANDARD III.D The College is self-
- Page 213 and 214:
STANDARD III.D All of California’
- Page 215 and 216:
STANDARD III.D The District receive
- Page 217 and 218:
STANDARD III.D College’s lead fin
- Page 219 and 220:
STANDARD III.D the highest level of
- Page 221 and 222:
STANDARD IV Leadership & Governence
- Page 223 and 224:
STANDARD IV I. Overview of the Stan
- Page 225 and 226:
STANDARD IV agreement was brought b
- Page 227 and 228:
STANDARD IV The College’s communi
- Page 229 and 230:
STANDARD IV The Board reviews, eval
- Page 231 and 232:
STANDARD IV or regulation to the co
- Page 233 and 234:
STANDARD IV The Chancellor establis
- Page 235 and 236:
STANDARD IV III. Strengths & Areas
- Page 237 and 238:
STANDARD IV Ref. 27 Ref. 28 CCSF Te
- Page 239 and 240:
INTRODUCTION TO THE THEME ESSAYS In
- Page 241 and 242:
THEME TAB I THEME I
- Page 243 and 244:
THEME I I. Overview This essay prov
- Page 245 and 246:
THEME I College), and refined the M
- Page 247 and 248:
THEME I These findings called atten
- Page 249 and 250:
THEME I success (analyzing the prog
- Page 251 and 252:
THEME I methods for their participa
- Page 253 and 254:
THEME I Beyond Instruction: Additio
- Page 255 and 256:
THEME I V. Resources Res. 1 Res. 2
- Page 257 and 258:
THEME II: Student Learning Outcomes
- Page 259 and 260:
THEME II outcomes assessment in the
- Page 261 and 262:
THEME II City College of San Franci
- Page 263 and 264:
THEME II Over half of the colleges
- Page 265 and 266:
THEME II learning outcomes for all
- Page 267 and 268:
THEME II The English Department’s
- Page 269 and 270:
THEME II The responses to this inve
- Page 271 and 272:
THEME II While indirect measures ca
- Page 273 and 274:
THEME II “Another potential sourc
- Page 275 and 276:
THEME TAB III THEME III
- Page 277 and 278:
THEME III I. Overview College dialo
- Page 279 and 280:
THEME III Dialogs regarding student
- Page 281 and 282:
THEME III • DACUM (Designing A Cu
- Page 283 and 284:
THEME III needs of both. As a resul
- Page 285 and 286:
THEME III At the Mission Campus, in
- Page 287 and 288:
THEME III V. Resources Res. 1 Liste
- Page 289 and 290:
THEME IV: Evaluation, Planning, & I
- Page 291 and 292:
THEME IV requirements necessary to
- Page 293 and 294:
THEME IV The Steering Committee for
- Page 295 and 296:
THEME IV Many of the recommendation
- Page 297 and 298:
THEME IV appropriate, College funds
- Page 299 and 300:
THEME IV Collaboration has allowed
- Page 301 and 302:
THEME IV Continuous improvement. Th
- Page 303 and 304:
THEME IV Once the problem has been
- Page 305 and 306:
THEME TAB V THEME V
- Page 307 and 308:
THEME V I. Overview This essay illu
- Page 309 and 310:
THEME V The College supports progra
- Page 311 and 312:
THEME V Organizational support for
- Page 313 and 314:
THEME V Biotechnology Program. Biot
- Page 315 and 316:
THEME V Organizational support for
- Page 317 and 318:
THEME V Administrative support for
- Page 319 and 320:
THEME V The College is committed to
- Page 321 and 322:
THEME TAB VI THEME VI
- Page 323 and 324:
THEME VI I. Overview Demonstrating
- Page 325 and 326:
THEME VI registration), and second,
- Page 327 and 328:
THEME VI of California. The service
- Page 329 and 330:
THEME VI Evaluation of the Shared G
- Page 331 and 332:
THEME VI The College’s weekly new
- Page 333 and 334:
THEME VI The College has a clear co
- Page 335 and 336:
THEME VI The College Diversity Comm
- Page 337 and 338:
THEME VI V. Resources Res. 1 Instit
- Page 339 and 340:
MAJOR FINDINGS
- Page 341 and 342:
MAJOR FINDINGS Teaching & Learning
- Page 343:
MAJOR FINDINGS 12. Expand efforts t