Infrastructure Delivery Plan (Feb 2013) - Runnymede Borough Council
Infrastructure Delivery Plan (Feb 2013) - Runnymede Borough Council
Infrastructure Delivery Plan (Feb 2013) - Runnymede Borough Council

You also want an ePaper? Increase the reach of your titles
YUMPU automatically turns print PDFs into web optimized ePapers that Google loves.
There are reported to be in excess of 2100 different species in the <strong>Borough</strong>; 32 of them<br />
are Biodiversity Action <strong>Plan</strong> species. These are supported in 19 different habitats 4 .<br />
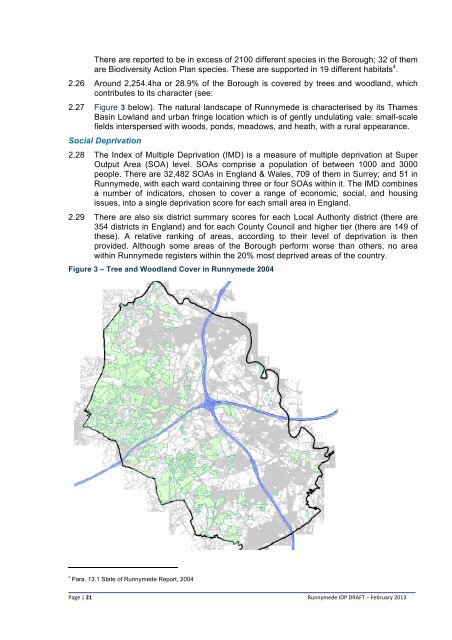
2.26 Around 2,254.4ha or 28.9% of the <strong>Borough</strong> is covered by trees and woodland, which<br />
contributes to its character (see:<br />
2.27 Figure 3 below). The natural landscape of <strong>Runnymede</strong> is characterised by its Thames<br />
Basin Lowland and urban fringe location which is of gently undulating vale: small-scale<br />
fields interspersed with woods, ponds, meadows, and heath, with a rural appearance.<br />
Social Deprivation<br />
2.28 The Index of Multiple Deprivation (IMD) is a measure of multiple deprivation at Super<br />
Output Area (SOA) level. SOAs comprise a population of between 1000 and 3000<br />
people. There are 32,482 SOAs in England & Wales, 709 of them in Surrey; and 51 in<br />
<strong>Runnymede</strong>, with each ward containing three or four SOAs within it. The IMD combines<br />
a number of indicators, chosen to cover a range of economic, social, and housing<br />
issues, into a single deprivation score for each small area in England.<br />
2.29 There are also six district summary scores for each Local Authority district (there are<br />
354 districts in England) and for each County <strong>Council</strong> and higher tier (there are 149 of<br />
these). A relative ranking of areas, according to their level of deprivation is then<br />
provided. Although some areas of the <strong>Borough</strong> perform worse than others, no area<br />
within <strong>Runnymede</strong> registers within the 20% most deprived areas of the country.<br />
Figure 3 – Tree and Woodland Cover in <strong>Runnymede</strong> 2004<br />
4<br />
Para. 13.1 State of <strong>Runnymede</strong> Report, 2004 <br />
Page | 21<br />
<strong>Runnymede</strong> IDP DRAFT – <strong>Feb</strong>ruary <strong>2013</strong>