Infrastructure Delivery Plan (Feb 2013) - Runnymede Borough Council
Infrastructure Delivery Plan (Feb 2013) - Runnymede Borough Council
Infrastructure Delivery Plan (Feb 2013) - Runnymede Borough Council

Create successful ePaper yourself
Turn your PDF publications into a flip-book with our unique Google optimized e-Paper software.
6.59 In <strong>Runnymede</strong>, 2,516 people were reported to travel to work by train in 2001 23 .This<br />
equates to a higher than average percentage (when contrasted with England as a<br />
whole) and is considered to reflect the accessibility of train stations in the <strong>Borough</strong>.<br />
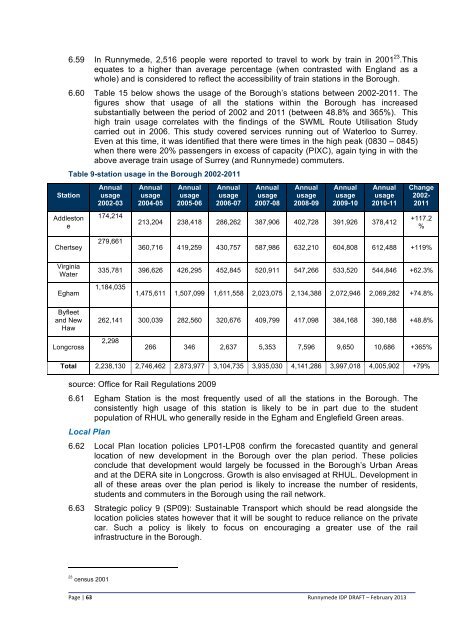
6.60 Table 15 below shows the usage of the <strong>Borough</strong>’s stations between 2002-2011. The<br />
figures show that usage of all the stations within the <strong>Borough</strong> has increased<br />
substantially between the period of 2002 and 2011 (between 48.8% and 365%). This<br />
high train usage correlates with the findings of the SWML Route Utilisation Study<br />
carried out in 2006. This study covered services running out of Waterloo to Surrey.<br />
Even at this time, it was identified that there were times in the high peak (0830 – 0845)<br />
when there were 20% passengers in excess of capacity (PIXC), again tying in with the<br />
above average train usage of Surrey (and <strong>Runnymede</strong>) commuters.<br />
Table 9-station usage in the <strong>Borough</strong> 2002-2011<br />
Station<br />
Addleston<br />
e<br />
Annual<br />
usage<br />
2002-03<br />
174,214<br />
Annual<br />
usage<br />
2004-05<br />
Annual<br />
usage<br />
2005-06<br />
Annual<br />
usage<br />
2006-07<br />
Annual<br />
usage<br />
2007-08<br />
Annual<br />
usage<br />
2008-09<br />
Annual<br />
usage<br />
2009-10<br />
Annual<br />
usage<br />
2010-11<br />
213,204 238,418 286,262 387,906 402,728 391,926 378,412<br />
Change<br />
2002-<br />
2011<br />
+117.2<br />
%<br />
Chertsey<br />
279,661<br />
360,716 419,259 430,757 587,986 632,210 604,808 612,488 +119%<br />
Virginia<br />
Water<br />
335,781 396,626 426,295 452,845 520,911 547,266 533,520 544,846 +62.3%<br />
Egham<br />
1,184,035<br />
1,475,611 1,507,099 1,611,558 2,023,075 2,134,388 2,072,946 2,069,282 +74.8%<br />
Byfleet<br />
and New<br />
Haw<br />
262,141 300,039 282,560 320,676 409,799 417,098 384,168 390,188 +48.8%<br />
Longcross<br />
2,298<br />
266 346 2,637 5,353 7,596 9,650 10,686 +365%<br />
Total 2,238,130 2,746,462 2,873,977 3,104,735 3,935,030 4,141,286 3,997,018 4,005,902 +79%<br />
source: Office for Rail Regulations 2009<br />
6.61 Egham Station is the most frequently used of all the stations in the <strong>Borough</strong>. The<br />
consistently high usage of this station is likely to be in part due to the student<br />
population of RHUL who generally reside in the Egham and Englefield Green areas.<br />
Local <strong>Plan</strong><br />
6.62 Local <strong>Plan</strong> location policies LP01-LP08 confirm the forecasted quantity and general<br />
location of new development in the <strong>Borough</strong> over the plan period. These policies<br />
conclude that development would largely be focussed in the <strong>Borough</strong>’s Urban Areas<br />
and at the DERA site in Longcross. Growth is also envisaged at RHUL. Development in<br />
all of these areas over the plan period is likely to increase the number of residents,<br />
students and commuters in the <strong>Borough</strong> using the rail network.<br />
6.63 Strategic policy 9 (SP09): Sustainable Transport which should be read alongside the<br />
location policies states however that it will be sought to reduce reliance on the private<br />
car. Such a policy is likely to focus on encouraging a greater use of the rail<br />
infrastructure in the <strong>Borough</strong>.<br />
23<br />
census 2001 <br />
Page | 63<br />
<strong>Runnymede</strong> IDP DRAFT – <strong>Feb</strong>ruary <strong>2013</strong>