Infrastructure Delivery Plan (Feb 2013) - Runnymede Borough Council
Infrastructure Delivery Plan (Feb 2013) - Runnymede Borough Council
Infrastructure Delivery Plan (Feb 2013) - Runnymede Borough Council

You also want an ePaper? Increase the reach of your titles
YUMPU automatically turns print PDFs into web optimized ePapers that Google loves.
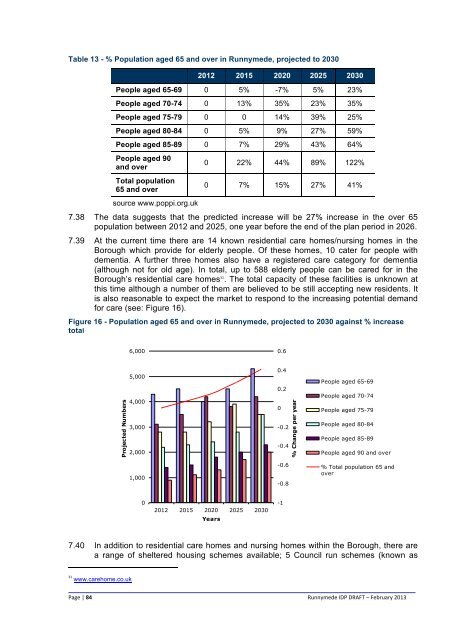
Table 13 - % Population aged 65 and over in <strong>Runnymede</strong>, projected to 2030<br />
2012 2015 2020 2025 2030<br />
People aged 65-69 0 5% -7% 5% 23%<br />
People aged 70-74 0 13% 35% 23% 35%<br />
People aged 75-79 0 0 14% 39% 25%<br />
People aged 80-84 0 5% 9% 27% 59%<br />
People aged 85-89 0 7% 29% 43% 64%<br />
People aged 90<br />
and over<br />
Total population<br />
65 and over<br />
source www.poppi.org.uk<br />
0 22% 44% 89% 122%<br />
0 7% 15% 27% 41%<br />
7.38 The data suggests that the predicted increase will be 27% increase in the over 65<br />
population between 2012 and 2025, one year before the end of the plan period in 2026.<br />
7.39 At the current time there are 14 known residential care homes/nursing homes in the<br />
<strong>Borough</strong> which provide for elderly people. Of these homes, 10 cater for people with<br />
dementia. A further three homes also have a registered care category for dementia<br />
(although not for old age). In total, up to 588 elderly people can be cared for in the<br />
<strong>Borough</strong>’s residential care homes 31 . The total capacity of these facilities is unknown at<br />
this time although a number of them are believed to be still accepting new residents. It<br />
is also reasonable to expect the market to respond to the increasing potential demand<br />
for care (see: Figure 16).<br />
Figure 16 - Population aged 65 and over in <strong>Runnymede</strong>, projected to 2030 against % increase<br />
total<br />
6,000<br />
0.6<br />
Projected Numbers<br />
5,000<br />
4,000<br />
3,000<br />
2,000<br />
1,000<br />
0.4<br />
0.2<br />
0<br />
-0.2<br />
-0.4<br />
-0.6<br />
-0.8<br />
% Change per year<br />
People aged 65-69<br />
People aged 70-74<br />
People aged 75-79<br />
People aged 80-84<br />
People aged 85-89<br />
People aged 90 and over<br />
% Total population 65 and<br />
over<br />
0<br />
2012 2015 2020 2025 2030<br />
Years<br />
-1<br />
7.40 In addition to residential care homes and nursing homes within the <strong>Borough</strong>, there are<br />
a range of sheltered housing schemes available; 5 <strong>Council</strong> run schemes (known as<br />
31<br />
www.carehome.co.uk <br />
Page | 84<br />
<strong>Runnymede</strong> IDP DRAFT – <strong>Feb</strong>ruary <strong>2013</strong>