Infrastructure Delivery Plan (Feb 2013) - Runnymede Borough Council
Infrastructure Delivery Plan (Feb 2013) - Runnymede Borough Council
Infrastructure Delivery Plan (Feb 2013) - Runnymede Borough Council

You also want an ePaper? Increase the reach of your titles
YUMPU automatically turns print PDFs into web optimized ePapers that Google loves.
Conclusion<br />
Risk ID Description Probability Severity<br />
IDPR017<br />
Growth of hospital catchment area<br />
outpacing growth of St Peter’s Hospital<br />
Low<br />
High (for<br />
those<br />
involved)<br />
7.34 The masterplan at St Peters Hospital will allow for improvements to the facilities during<br />
the plan period to accommodate an increased population. The requirement for<br />
additional secondary healthcare facilities over and above those already approved at St<br />
Peters Hospital is considered highly unlikely during the plan period. This is in part due<br />
to the existing provision at St Peters Hospital, in conjunction with Green Belt and<br />
flooding constraints elsewhere in the <strong>Borough</strong><br />
Private healthcare, nursing and residential care<br />
Existing conditions and provision<br />
7.35 As mentioned elsewhere in this report, both <strong>Runnymede</strong>’s and Surrey’s population is<br />
predicted to rise over the coming decade with notable increases in the number of<br />
people aged 65 and over. Specifically, the ‘Adult Social Care Commissioning Strategy<br />
for older people in Surrey 2011-2020’ states that the 65+ population will increase by<br />
10.8% and 19.6% by 2015 and 2020 respectively. The life expectancy in Surrey for<br />
men is 79.8 and 83.3 for women. Overall the 65+ population is expected to overtake<br />
that of the under 16s within 20 years.<br />
7.36 It is estimated that there are 14,830 people with dementia over the age of 65 in Surrey<br />
at the current time with a projected increase to 18,600 by 2020. This reflects the<br />
national forecast for an ageing population. As at 2011, 20,623 people in Surrey have a<br />
learning disability, with 3,969 aged 65 and over. The latter figure is expected to rise by<br />
over 20% to approximately 4,800 by 2020 (Adult Social Care Commissioning Strategy<br />
for older people in Surrey 2011-2020).<br />
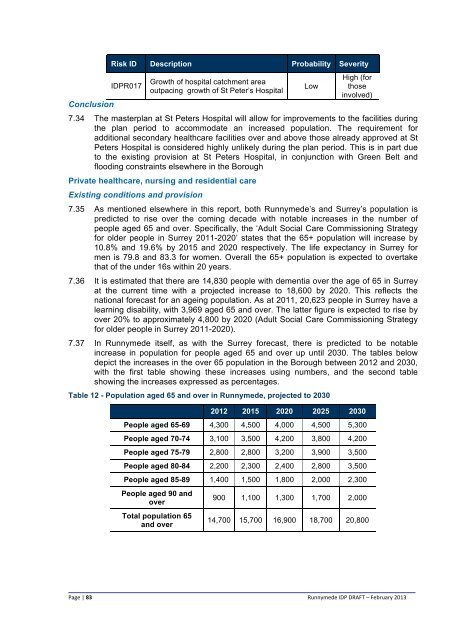
7.37 In <strong>Runnymede</strong> itself, as with the Surrey forecast, there is predicted to be notable<br />
increase in population for people aged 65 and over up until 2030. The tables below<br />
depict the increases in the over 65 population in the <strong>Borough</strong> between 2012 and 2030,<br />
with the first table showing these increases using numbers, and the second table<br />
showing the increases expressed as percentages.<br />
Table 12 - Population aged 65 and over in <strong>Runnymede</strong>, projected to 2030<br />
2012 2015 2020 2025 2030<br />
People aged 65-69 4,300 4,500 4,000 4,500 5,300<br />
People aged 70-74 3,100 3,500 4,200 3,800 4,200<br />
People aged 75-79 2,800 2,800 3,200 3,900 3,500<br />
People aged 80-84 2,200 2,300 2,400 2,800 3,500<br />
People aged 85-89 1,400 1,500 1,800 2,000 2,300<br />
People aged 90 and<br />
over<br />
Total population 65<br />
and over<br />
900 1,100 1,300 1,700 2,000<br />
14,700 15,700 16,900 18,700 20,800<br />
Page | 83<br />
<strong>Runnymede</strong> IDP DRAFT – <strong>Feb</strong>ruary <strong>2013</strong>