Infrastructure Delivery Plan (Feb 2013) - Runnymede Borough Council
Infrastructure Delivery Plan (Feb 2013) - Runnymede Borough Council
Infrastructure Delivery Plan (Feb 2013) - Runnymede Borough Council

Create successful ePaper yourself
Turn your PDF publications into a flip-book with our unique Google optimized e-Paper software.
• A317 - runs through Weybridge town centre, through Addlestone, to join the<br />
M25 at junction 11<br />
• A318-runs from Chertsey to Byfleet<br />
• A319-runs from Lightwater to Chertsey<br />
• A320-runs from Guildford through Ottershaw and Chertsey within the<br />
<strong>Borough</strong> and up to Staines<br />
• A30-runs from Hounslow through Egham within the <strong>Borough</strong> and eventually<br />
on to Land’s End<br />
• A308-runs from Brompton to Maidenhead, running through Staines and past<br />
the <strong>Runnymede</strong> Meadows at the northernmost part of the <strong>Borough</strong><br />
6.20 Traffic flows on A roads in Surrey are far higher than the national average, averaging<br />
21,400 vehicles per day (Annual Average Daily Traffic (AADT)), 64% higher than the<br />
national average of 13,079 vehicles per day (Surrey County <strong>Council</strong>, movement<br />
monitoring report, 2008). This means that there is significant amount of traffic passing<br />
through the <strong>Borough</strong> on a daily basis. The Surrey <strong>Infrastructure</strong> Capacity Study (June<br />
2009) notes that the ‘traffic volume over capacity (V/C) ratio’ is particularly problematic<br />
on the A318 Chertsey Road, and on the A320 Guildford Road. Surrey County <strong>Council</strong><br />
has also identified the <strong>Runnymede</strong> Roundabout as being, ‘highly problematic in terms<br />
of severe queuing and delay to motorists’.<br />
6.21 The car is the preferred mode of personal transport in the <strong>Borough</strong> and over two thirds<br />
of people travel to work by car in <strong>Runnymede</strong>, making it the most heavily relied upon<br />
mode. This is 7% higher than for England as a whole. In terms of sustainable travel,<br />
England as a whole has nearly doubled the amount of people travelling to work by<br />
sustainable modes of transport (such as public transport) than <strong>Runnymede</strong> (14.5% and<br />
8.2% respectively) 18 .<br />
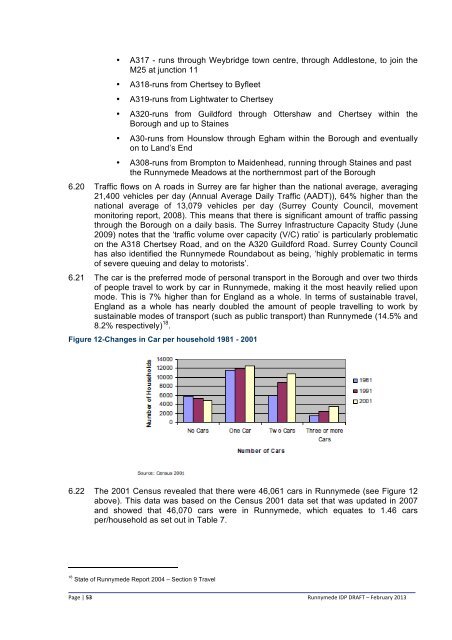
Figure 12-Changes in Car per household 1981 - 2001<br />
6.22 The 2001 Census revealed that there were 46,061 cars in <strong>Runnymede</strong> (see Figure 12<br />
above). This data was based on the Census 2001 data set that was updated in 2007<br />
and showed that 46,070 cars were in <strong>Runnymede</strong>, which equates to 1.46 cars<br />
per/household as set out in Table 7.<br />
18<br />
State of <strong>Runnymede</strong> Report 2004 – Section 9 Travel<br />
Page | 53<br />
<strong>Runnymede</strong> IDP DRAFT – <strong>Feb</strong>ruary <strong>2013</strong>