Infrastructure Delivery Plan (Feb 2013) - Runnymede Borough Council
Infrastructure Delivery Plan (Feb 2013) - Runnymede Borough Council
Infrastructure Delivery Plan (Feb 2013) - Runnymede Borough Council

You also want an ePaper? Increase the reach of your titles
YUMPU automatically turns print PDFs into web optimized ePapers that Google loves.
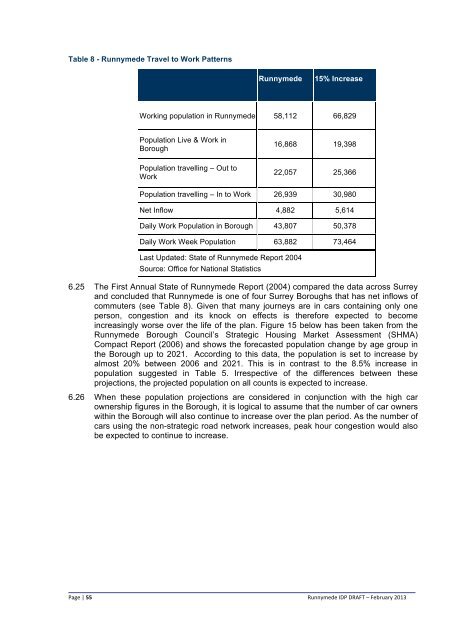
Table 8 - <strong>Runnymede</strong> Travel to Work Patterns<br />
<strong>Runnymede</strong><br />
15% Increase<br />
Working population in <strong>Runnymede</strong> 58,112 66,829<br />
Population Live & Work in<br />
<strong>Borough</strong><br />
16,868 19,398<br />
Population travelling – Out to<br />
Work<br />
22,057 25,366<br />
Population travelling – In to Work 26,939 30,980<br />
Net Inflow 4,882 5,614<br />
Daily Work Population in <strong>Borough</strong> 43,807 50,378<br />
Daily Work Week Population 63,882 73,464<br />
Last Updated: State of <strong>Runnymede</strong> Report 2004<br />
Source: Office for National Statistics<br />
6.25 The First Annual State of <strong>Runnymede</strong> Report (2004) compared the data across Surrey<br />
and concluded that <strong>Runnymede</strong> is one of four Surrey <strong>Borough</strong>s that has net inflows of<br />
commuters (see Table 8). Given that many journeys are in cars containing only one<br />
person, congestion and its knock on effects is therefore expected to become<br />
increasingly worse over the life of the plan. Figure 15 below has been taken from the<br />
<strong>Runnymede</strong> <strong>Borough</strong> <strong>Council</strong>’s Strategic Housing Market Assessment (SHMA)<br />
Compact Report (2006) and shows the forecasted population change by age group in<br />
the <strong>Borough</strong> up to 2021. According to this data, the population is set to increase by<br />
almost 20% between 2006 and 2021. This is in contrast to the 8.5% increase in<br />
population suggested in Table 5. Irrespective of the differences between these<br />
projections, the projected population on all counts is expected to increase.<br />
6.26 When these population projections are considered in conjunction with the high car<br />
ownership figures in the <strong>Borough</strong>, it is logical to assume that the number of car owners<br />
within the <strong>Borough</strong> will also continue to increase over the plan period. As the number of<br />
cars using the non-strategic road network increases, peak hour congestion would also<br />
be expected to continue to increase.<br />
Page | 55<br />
<strong>Runnymede</strong> IDP DRAFT – <strong>Feb</strong>ruary <strong>2013</strong>