

STATISTICS
c2drS
c2drS
- No tags were found...

Create successful ePaper yourself
Turn your PDF publications into a flip-book with our unique Google optimized e-Paper software.
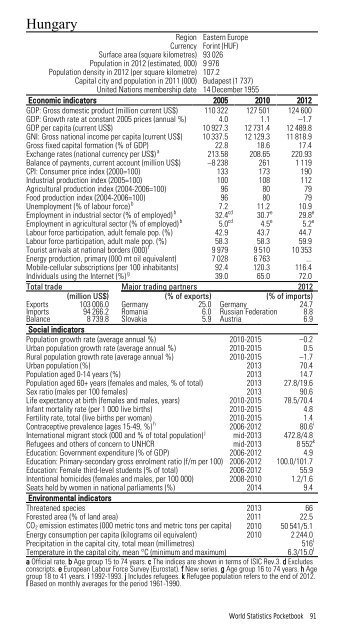
HungaryRegion Eastern EuropeCurrency Forint (HUF)Surface area (square kilometres) 93 026Population in 2012 (estimated, 000) 9 976Population density in 2012 (per square kilometre) 107.2Capital city and population in 2011 (000) Budapest (1 737)United Nations membership date 14 December 1955Economic indicators 2005 2010 2012GDP: Gross domestic product (million current US$) 110 322 127 501 124 600GDP: Growth rate at constant 2005 prices (annual %) 4.0 1.1 –1.7GDP per capita (current US$) 10 927.3 12 731.4 12 489.8GNI: Gross national income per capita (current US$) 10 337.5 12 129.3 11 818.9Gross fixed capital formation (% of GDP) 22.8 18.6 17.4Exchange rates (national currency per US$) a 213.58 208.65 220.93Balance of payments, current account (million US$) –8 238 261 1 119CPI: Consumer price index (2000=100) 133 173 190Industrial production index (2005=100) 100 108 112Agricultural production index (2004-2006=100) 96 80 79Food production index (2004-2006=100) 96 80 79Unemployment (% of labour force) b 7.2 11.2 10.9Employment in industrial sector (% of employed) b 32.4 cd 30.7 e 29.8 eEmployment in agricultural sector (% of employed) b 5.0 cd 4.5 e 5.2 eLabour force participation, adult female pop. (%) 42.9 43.7 44.7Labour force participation, adult male pop. (%) 58.3 58.3 59.9Tourist arrivals at national borders (000) f 9 979 9 510 10 353Energy production, primary (000 mt oil equivalent) 7 028 6 763 ...Mobile-cellular subscriptions (per 100 inhabitants) 92.4 120.3 116.4Individuals using the Internet (%) g 39.0 65.0 72.0Total trade Major trading partners 2012(million US$) (% of exports) (% of imports)Exports 103 006.0 Germany 25.0 Germany 24.7Imports 94 266.2 Romania 6.0 Russian Federation 8.8Balance 8 739.8 Slovakia 5.9 Austria 6.9Social indicatorsPopulation growth rate (average annual %) 2010-2015 –0.2Urban population growth rate (average annual %) 2010-2015 0.5Rural population growth rate (average annual %) 2010-2015 –1.7Urban population (%) 2013 70.4Population aged 0-14 years (%) 2013 14.7Population aged 60+ years (females and males, % of total) 2013 27.8/19.6Sex ratio (males per 100 females) 2013 90.6Life expectancy at birth (females and males, years) 2010-2015 78.5/70.4Infant mortality rate (per 1 000 live births) 2010-2015 4.8Fertility rate, total (live births per woman) 2010-2015 1.4Contraceptive prevalence (ages 15-49, %) h 2006-2012 80.6 iInternational migrant stock (000 and % of total population) j mid-2013 472.8/4.8Refugees and others of concern to UNHCR mid-2013 8 552 kEducation: Government expenditure (% of GDP) 2006-2012 4.9Education: Primary-secondary gross enrolment ratio (f/m per 100) 2006-2012 100.0/101.7Education: Female third-level students (% of total) 2006-2012 55.9Intentional homicides (females and males, per 100 000) 2008-2010 1.2/1.6Seats held by women in national parliaments (%) 2014 9.4Environmental indicatorsThreatened species 2013 66Forested area (% of land area) 2011 22.5CO 2 emission estimates (000 metric tons and metric tons per capita) 2010 50 541/5.1Energy consumption per capita (kilograms oil equivalent) 2010 2 244.0Precipitation in the capital city, total mean (millimetres)516 lTemperature in the capital city, mean °C (minimum and maximum)6.3/15.0 la Official rate. b Age group 15 to 74 years. c The indices are shown in terms of ISIC Rev.3. d Excludesconscripts. e European Labour Force Survey (Eurostat). f New series. g Age group 16 to 74 years. h Agegroup 18 to 41 years. i 1992-1993. j Includes refugees. k Refugee population refers to the end of 2012.l Based on monthly averages for the period 1961-1990.World Statistics Pocketbook 91