

STATISTICS
c2drS
c2drS
- No tags were found...

Create successful ePaper yourself
Turn your PDF publications into a flip-book with our unique Google optimized e-Paper software.
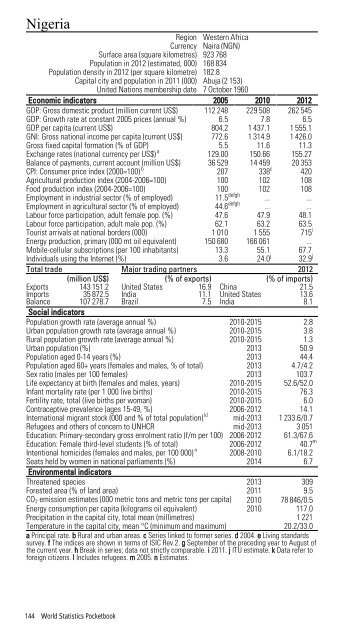
NigeriaRegion Western AfricaCurrency Naira (NGN)Surface area (square kilometres) 923 768Population in 2012 (estimated, 000) 168 834Population density in 2012 (per square kilometre) 182.8Capital city and population in 2011 (000) Abuja (2 153)United Nations membership date 7 October 1960Economic indicators 2005 2010 2012GDP: Gross domestic product (million current US$) 112 248 229 508 262 545GDP: Growth rate at constant 2005 prices (annual %) 6.5 7.8 6.5GDP per capita (current US$) 804.2 1 437.1 1 555.1GNI: Gross national income per capita (current US$) 772.6 1 314.9 1 426.0Gross fixed capital formation (% of GDP) 5.5 11.6 11.3Exchange rates (national currency per US$) a 129.00 150.66 155.27Balance of payments, current account (million US$) 36 529 14 459 20 353CPI: Consumer price index (2000=100) b 207 338 c 420Agricultural production index (2004-2006=100) 100 102 108Food production index (2004-2006=100) 100 102 108Employment in industrial sector (% of employed) 11.5 defgh ... ...Employment in agricultural sector (% of employed) 44.6 defgh ... ...Labour force participation, adult female pop. (%) 47.6 47.9 48.1Labour force participation, adult male pop. (%) 62.1 63.2 63.5Tourist arrivals at national borders (000) 1 010 1 555 715 iEnergy production, primary (000 mt oil equivalent) 150 680 166 061 ...Mobile-cellular subscriptions (per 100 inhabitants) 13.3 55.1 67.7Individuals using the Internet (%) 3.6 24.0 j 32.9 jTotal trade Major trading partners 2012(million US$) (% of exports) (% of imports)Exports 143 151.2 United States 16.9 China 21.5Imports 35 872.5 India 11.1 United States 13.6Balance 107 278.7 Brazil 7.5 India 8.1Social indicatorsPopulation growth rate (average annual %) 2010-2015 2.8Urban population growth rate (average annual %) 2010-2015 3.8Rural population growth rate (average annual %) 2010-2015 1.3Urban population (%) 2013 50.9Population aged 0-14 years (%) 2013 44.4Population aged 60+ years (females and males, % of total) 2013 4.7/4.2Sex ratio (males per 100 females) 2013 103.7Life expectancy at birth (females and males, years) 2010-2015 52.6/52.0Infant mortality rate (per 1 000 live births) 2010-2015 76.3Fertility rate, total (live births per woman) 2010-2015 6.0Contraceptive prevalence (ages 15-49, %) 2006-2012 14.1International migrant stock (000 and % of total population) kl mid-2013 1 233.6/0.7Refugees and others of concern to UNHCR mid-2013 3 051Education: Primary-secondary gross enrolment ratio (f/m per 100) 2006-2012 61.3/67.6Education: Female third-level students (% of total) 2006-2012 40.7 mIntentional homicides (females and males, per 100 000) n 2008-2010 6.1/18.2Seats held by women in national parliaments (%) 2014 6.7Environmental indicatorsThreatened species 2013 309Forested area (% of land area) 2011 9.5CO 2 emission estimates (000 metric tons and metric tons per capita) 2010 78 846/0.5Energy consumption per capita (kilograms oil equivalent) 2010 117.0Precipitation in the capital city, total mean (millimetres) 1 221Temperature in the capital city, mean °C (minimum and maximum) 20.2/33.0a Principal rate. b Rural and urban areas. c Series linked to former series. d 2004. e Living standardssurvey. f The indices are shown in terms of ISIC Rev.2. g September of the preceding year to August ofthe current year. h Break in series; data not strictly comparable. i 2011. j ITU estimate. k Data refer toforeign citizens. l Includes refugees. m 2005. n Estimates.144 World Statistics Pocketbook