

STATISTICS
c2drS
c2drS
- No tags were found...

You also want an ePaper? Increase the reach of your titles
YUMPU automatically turns print PDFs into web optimized ePapers that Google loves.
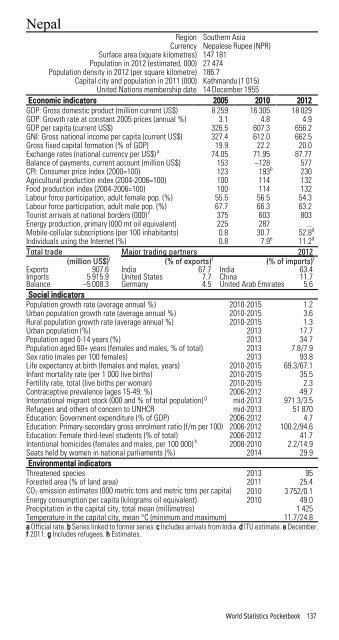
NepalRegion Southern AsiaCurrency Nepalese Rupee (NPR)Surface area (square kilometres) 147 181Population in 2012 (estimated, 000) 27 474Population density in 2012 (per square kilometre) 186.7Capital city and population in 2011 (000) Kathmandu (1 015)United Nations membership date 14 December 1955Economic indicators 2005 2010 2012GDP: Gross domestic product (million current US$) 8 259 16 305 18 029GDP: Growth rate at constant 2005 prices (annual %) 3.1 4.8 4.9GDP per capita (current US$) 326.5 607.3 656.2GNI: Gross national income per capita (current US$) 327.4 612.0 662.5Gross fixed capital formation (% of GDP) 19.9 22.2 20.0Exchange rates (national currency per US$) a 74.05 71.95 87.77Balance of payments, current account (million US$) 153 –128 577CPI: Consumer price index (2000=100) 123 193 b 230Agricultural production index (2004-2006=100) 100 114 132Food production index (2004-2006=100) 100 114 132Labour force participation, adult female pop. (%) 55.5 56.5 54.3Labour force participation, adult male pop. (%) 67.7 66.3 63.2Tourist arrivals at national borders (000) c 375 603 803Energy production, primary (000 mt oil equivalent) 225 287 ...Mobile-cellular subscriptions (per 100 inhabitants) 0.8 30.7 52.8 dIndividuals using the Internet (%) 0.8 7.9 e 11.2 dTotal trade Major trading partners 2012(million US$) f (% of exports) f (% of imports) fExports 907.6 India 67.7 India 63.4Imports 5 915.9 United States 7.7 China 11.7Balance –5 008.3 Germany 4.5 United Arab Emirates 5.6Social indicatorsPopulation growth rate (average annual %) 2010-2015 1.2Urban population growth rate (average annual %) 2010-2015 3.6Rural population growth rate (average annual %) 2010-2015 1.3Urban population (%) 2013 17.7Population aged 0-14 years (%) 2013 34.7Population aged 60+ years (females and males, % of total) 2013 7.8/7.9Sex ratio (males per 100 females) 2013 93.8Life expectancy at birth (females and males, years) 2010-2015 69.3/67.1Infant mortality rate (per 1 000 live births) 2010-2015 35.5Fertility rate, total (live births per woman) 2010-2015 2.3Contraceptive prevalence (ages 15-49, %) 2006-2012 49.7International migrant stock (000 and % of total population) g mid-2013 971.3/3.5Refugees and others of concern to UNHCR mid-2013 51 870Education: Government expenditure (% of GDP) 2006-2012 4.7Education: Primary-secondary gross enrolment ratio (f/m per 100) 2006-2012 100.2/94.6Education: Female third-level students (% of total) 2006-2012 41.7Intentional homicides (females and males, per 100 000) h 2008-2010 2.2/14.9Seats held by women in national parliaments (%) 2014 29.9Environmental indicatorsThreatened species 2013 95Forested area (% of land area) 2011 25.4CO 2 emission estimates (000 metric tons and metric tons per capita) 2010 3 752/0.1Energy consumption per capita (kilograms oil equivalent) 2010 49.0Precipitation in the capital city, total mean (millimetres) 1 425Temperature in the capital city, mean °C (minimum and maximum) 11.7/24.8a Official rate. b Series linked to former series. c Includes arrivals from India. d ITU estimate. e December.f 2011. g Includes refugees. h Estimates.World Statistics Pocketbook 137