

STATISTICS
c2drS
c2drS
- No tags were found...

Create successful ePaper yourself
Turn your PDF publications into a flip-book with our unique Google optimized e-Paper software.
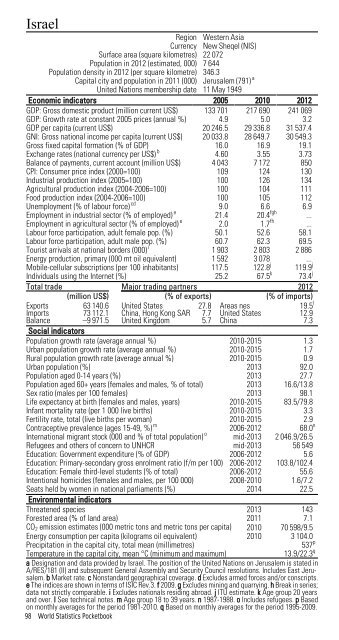
IsraelRegion Western AsiaCurrency New Sheqel (NIS)Surface area (square kilometres) 22 072Population in 2012 (estimated, 000) 7 644Population density in 2012 (per square kilometre) 346.3Capital city and population in 2011 (000) Jerusalem (791) aUnited Nations membership date 11 May 1949Economic indicators 2005 2010 2012GDP: Gross domestic product (million current US$) 133 701 217 690 241 069GDP: Growth rate at constant 2005 prices (annual %) 4.9 5.0 3.2GDP per capita (current US$) 20 246.5 29 336.8 31 537.4GNI: Gross national income per capita (current US$) 20 033.8 28 649.7 30 549.3Gross fixed capital formation (% of GDP) 16.0 16.9 19.1Exchange rates (national currency per US$) b 4.60 3.55 3.73Balance of payments, current account (million US$) 4 043 7 172 850CPI: Consumer price index (2000=100) 109 124 130Industrial production index (2005=100) 100 126 134Agricultural production index (2004-2006=100) 100 104 111Food production index (2004-2006=100) 100 105 112Unemployment (% of labour force) cd 9.0 6.6 6.9Employment in industrial sector (% of employed) e 21.4 20.4 fgh ...Employment in agricultural sector (% of employed) e 2.0 1.7 fh ...Labour force participation, adult female pop. (%) 50.1 52.6 58.1Labour force participation, adult male pop. (%) 60.7 62.3 69.5Tourist arrivals at national borders (000) i 1 903 2 803 2 886Energy production, primary (000 mt oil equivalent) 1 592 3 078 ...Mobile-cellular subscriptions (per 100 inhabitants) 117.5 122.8 j 119.9 jIndividuals using the Internet (%) 25.2 67.5 k 73.4 jTotal trade Major trading partners 2012(million US$) (% of exports) (% of imports)Exports 63 140.6 United States 27.8 Areas nes 19.5 lImports 73 112.1 China, Hong Kong SAR 7.7 United States 12.9Balance –9 971.5 United Kingdom 5.7 China 7.3Social indicatorsPopulation growth rate (average annual %) 2010-2015 1.3Urban population growth rate (average annual %) 2010-2015 1.7Rural population growth rate (average annual %) 2010-2015 0.9Urban population (%) 2013 92.0Population aged 0-14 years (%) 2013 27.7Population aged 60+ years (females and males, % of total) 2013 16.6/13.8Sex ratio (males per 100 females) 2013 98.1Life expectancy at birth (females and males, years) 2010-2015 83.5/79.8Infant mortality rate (per 1 000 live births) 2010-2015 3.3Fertility rate, total (live births per woman) 2010-2015 2.9Contraceptive prevalence (ages 15-49, %) m 2006-2012 68.0 nInternational migrant stock (000 and % of total population) o mid-2013 2 046.9/26.5Refugees and others of concern to UNHCR mid-2013 56 549Education: Government expenditure (% of GDP) 2006-2012 5.6Education: Primary-secondary gross enrolment ratio (f/m per 100) 2006-2012 103.8/102.4Education: Female third-level students (% of total) 2006-2012 55.6Intentional homicides (females and males, per 100 000) 2008-2010 1.6/7.2Seats held by women in national parliaments (%) 2014 22.5Environmental indicatorsThreatened species 2013 143Forested area (% of land area) 2011 7.1CO 2 emission estimates (000 metric tons and metric tons per capita) 2010 70 598/9.5Energy consumption per capita (kilograms oil equivalent) 2010 3 104.0Precipitation in the capital city, total mean (millimetres)537 pTemperature in the capital city, mean °C (minimum and maximum)13.9/22.3 qa Designation and data provided by Israel. The position of the United Nations on Jerusalem is stated inA/RES/181 (II) and subsequent General Assembly and Security Council resolutions. Includes East Jerusalem.b Market rate. c Nonstandard geographical coverage. d Excludes armed forces and/or conscripts.e The indices are shown in terms of ISIC Rev.3. f 2009. g Excludes mining and quarrying. h Break in series;data not strictly comparable. i Excludes nationals residing abroad. j ITU estimate. k Age group 20 yearsand over. l See technical notes. m Age group 18 to 39 years. n 1987-1988. o Includes refugees. p Basedon monthly averages for the period 1981-2010. q Based on monthly averages for the period 1995-2009.98 World Statistics Pocketbook