

STATISTICS
c2drS
c2drS
- No tags were found...

Create successful ePaper yourself
Turn your PDF publications into a flip-book with our unique Google optimized e-Paper software.
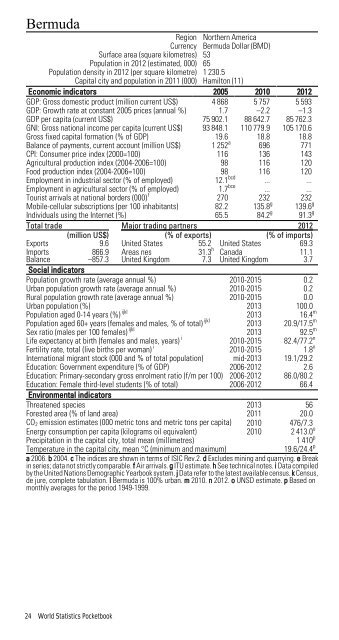
BermudaRegion Northern AmericaCurrency Bermuda Dollar (BMD)Surface area (square kilometres) 53Population in 2012 (estimated, 000) 65Population density in 2012 (per square kilometre) 1 230.5Capital city and population in 2011 (000) Hamilton (11)Economic indicators 2005 2010 2012GDP: Gross domestic product (million current US$) 4 868 5 757 5 593GDP: Growth rate at constant 2005 prices (annual %) 1.7 –2.2 –1.3GDP per capita (current US$) 75 902.1 88 642.7 85 762.3GNI: Gross national income per capita (current US$) 93 848.1 110 779.9 105 170.6Gross fixed capital formation (% of GDP) 19.6 18.8 18.8Balance of payments, current account (million US$) 1 252 a 696 771CPI: Consumer price index (2000=100) 116 136 143Agricultural production index (2004-2006=100) 98 116 120Food production index (2004-2006=100) 98 116 120Employment in industrial sector (% of employed) 12.1 bcd ... ...Employment in agricultural sector (% of employed) 1.7 bce ... ...Tourist arrivals at national borders (000) f 270 232 232Mobile-cellular subscriptions (per 100 inhabitants) 82.2 135.8 g 139.6 gIndividuals using the Internet (%) 65.5 84.2 g 91.3 gTotal trade Major trading partners 2012(million US$) (% of exports) (% of imports)Exports 9.6 United States 55.2 United States 69.3ImportsBalance866.9–857.3Areas nesUnited Kingdom31.3 h7.3CanadaUnited Kingdom11.13.7Social indicatorsPopulation growth rate (average annual %) 2010-2015 0.2Urban population growth rate (average annual %) 2010-2015 0.2Rural population growth rate (average annual %) 2010-2015 0.0Urban population (%) 2013 100.0Population aged 0-14 years (%) ijkl 2013 16.4 mPopulation aged 60+ years (females and males, % of total) ijkl 2013 20.9/17.5 mSex ratio (males per 100 females) ijkl 2013 92.5 mLife expectancy at birth (females and males, years) i 2010-2015 82.4/77.2 nFertility rate, total (live births per woman) i 2010-2015 1.8 nInternational migrant stock (000 and % of total population) mid-2013 19.1/29.2Education: Government expenditure (% of GDP) 2006-2012 2.6Education: Primary-secondary gross enrolment ratio (f/m per 100) 2006-2012 86.0/80.2Education: Female third-level students (% of total) 2006-2012 66.4Environmental indicatorsThreatened species 2013 56Forested area (% of land area) 2011 20.0CO 2 emission estimates (000 metric tons and metric tons per capita) 2010 476/7.3Energy consumption per capita (kilograms oil equivalent) 2010 2 413.0 oPrecipitation in the capital city, total mean (millimetres)1 410 pTemperature in the capital city, mean °C (minimum and maximum)19.6/24.4 pa 2006. b 2004. c The indices are shown in terms of ISIC Rev.2. d Excludes mining and quarrying. e Breakin series; data not strictly comparable. f Air arrivals. g ITU estimate. h See technical notes. i Data compiledby the United Nations Demographic Yearbook system. j Data refer to the latest available census. k Census,de jure, complete tabulation. l Bermuda is 100% urban. m 2010. n 2012. o UNSD estimate. p Based onmonthly averages for the period 1949-1999.24 World Statistics Pocketbook