

STATISTICS
c2drS
c2drS
- No tags were found...

You also want an ePaper? Increase the reach of your titles
YUMPU automatically turns print PDFs into web optimized ePapers that Google loves.
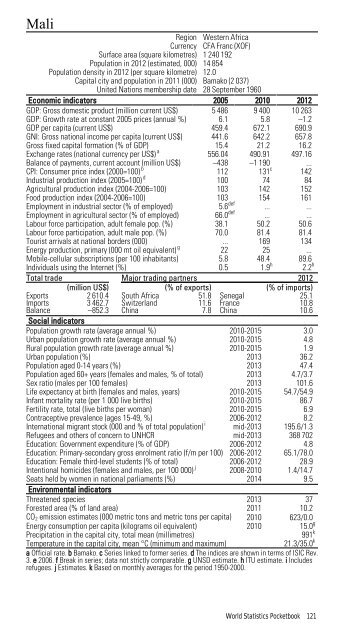
MaliRegion Western AfricaCurrency CFA Franc (XOF)Surface area (square kilometres) 1 240 192Population in 2012 (estimated, 000) 14 854Population density in 2012 (per square kilometre) 12.0Capital city and population in 2011 (000) Bamako (2 037)United Nations membership date 28 September 1960Economic indicators 2005 2010 2012GDP: Gross domestic product (million current US$) 5 486 9 400 10 263GDP: Growth rate at constant 2005 prices (annual %) 6.1 5.8 –1.2GDP per capita (current US$) 459.4 672.1 690.9GNI: Gross national income per capita (current US$) 441.6 642.2 657.8Gross fixed capital formation (% of GDP) 15.4 21.2 16.2Exchange rates (national currency per US$) a 556.04 490.91 497.16Balance of payments, current account (million US$) –438 –1 190 ...CPI: Consumer price index (2000=100) b 112 131 c 142Industrial production index (2005=100) d 100 74 84Agricultural production index (2004-2006=100) 103 142 152Food production index (2004-2006=100) 103 154 161Employment in industrial sector (% of employed) 5.6 def ... ...Employment in agricultural sector (% of employed) 66.0 def ... ...Labour force participation, adult female pop. (%) 38.1 50.2 50.6Labour force participation, adult male pop. (%) 70.0 81.4 81.4Tourist arrivals at national borders (000) ... 169 134Energy production, primary (000 mt oil equivalent) g 22 25 ...Mobile-cellular subscriptions (per 100 inhabitants) 5.8 48.4 89.6Individuals using the Internet (%) 0.5 1.9 h 2.2 hTotal trade Major trading partners 2012(million US$) (% of exports) (% of imports)Exports 2 610.4 South Africa 51.8 Senegal 25.1Imports 3 462.7 Switzerland 11.6 France 10.8Balance –852.3 China 7.8 China 10.6Social indicatorsPopulation growth rate (average annual %) 2010-2015 3.0Urban population growth rate (average annual %) 2010-2015 4.8Rural population growth rate (average annual %) 2010-2015 1.9Urban population (%) 2013 36.2Population aged 0-14 years (%) 2013 47.4Population aged 60+ years (females and males, % of total) 2013 4.7/3.7Sex ratio (males per 100 females) 2013 101.6Life expectancy at birth (females and males, years) 2010-2015 54.7/54.9Infant mortality rate (per 1 000 live births) 2010-2015 86.7Fertility rate, total (live births per woman) 2010-2015 6.9Contraceptive prevalence (ages 15-49, %) 2006-2012 8.2International migrant stock (000 and % of total population) i mid-2013 195.6/1.3Refugees and others of concern to UNHCR mid-2013 368 702Education: Government expenditure (% of GDP) 2006-2012 4.8Education: Primary-secondary gross enrolment ratio (f/m per 100) 2006-2012 65.1/78.0Education: Female third-level students (% of total) 2006-2012 28.9Intentional homicides (females and males, per 100 000) j 2008-2010 1.4/14.7Seats held by women in national parliaments (%) 2014 9.5Environmental indicatorsThreatened species 2013 37Forested area (% of land area) 2011 10.2CO 2 emission estimates (000 metric tons and metric tons per capita) 2010 623/0.0Energy consumption per capita (kilograms oil equivalent) 2010 15.0 gPrecipitation in the capital city, total mean (millimetres)991 kTemperature in the capital city, mean °C (minimum and maximum)21.3/35.0 ka Official rate. b Bamako. c Series linked to former series. d The indices are shown in terms of ISIC Rev.3. e 2006. f Break in series; data not strictly comparable. g UNSD estimate. h ITU estimate. i Includesrefugees. j Estimates. k Based on monthly averages for the period 1950-2000.World Statistics Pocketbook 121