

STATISTICS
c2drS
c2drS
- No tags were found...

You also want an ePaper? Increase the reach of your titles
YUMPU automatically turns print PDFs into web optimized ePapers that Google loves.
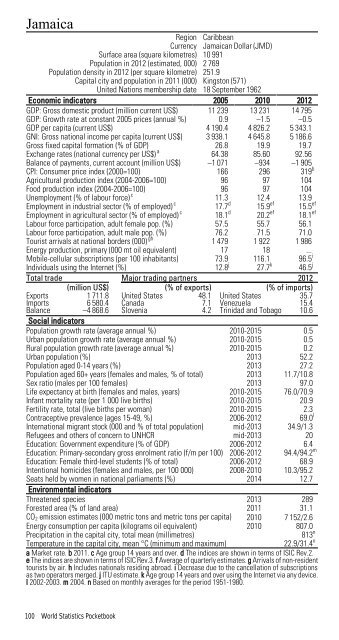
JamaicaRegion CaribbeanCurrency Jamaican Dollar (JMD)Surface area (square kilometres) 10 991Population in 2012 (estimated, 000) 2 769Population density in 2012 (per square kilometre) 251.9Capital city and population in 2011 (000) Kingston (571)United Nations membership date 18 September 1962Economic indicators 2005 2010 2012GDP: Gross domestic product (million current US$) 11 239 13 231 14 795GDP: Growth rate at constant 2005 prices (annual %) 0.9 –1.5 –0.5GDP per capita (current US$) 4 190.4 4 826.2 5 343.1GNI: Gross national income per capita (current US$) 3 938.1 4 645.8 5 186.6Gross fixed capital formation (% of GDP) 26.8 19.9 19.7Exchange rates (national currency per US$) a 64.38 85.60 92.56Balance of payments, current account (million US$) –1 071 –934 –1 905CPI: Consumer price index (2000=100) 166 296 319 bAgricultural production index (2004-2006=100) 96 97 104Food production index (2004-2006=100) 96 97 104Unemployment (% of labour force) c 11.3 12.4 13.9Employment in industrial sector (% of employed) c 17.7 d 15.9 ef 15.5 efEmployment in agricultural sector (% of employed) c 18.1 d 20.2 ef 18.1 efLabour force participation, adult female pop. (%) 57.5 55.7 56.1Labour force participation, adult male pop. (%) 76.2 71.5 71.0Tourist arrivals at national borders (000) gh 1 479 1 922 1 986Energy production, primary (000 mt oil equivalent) 17 18 ...Mobile-cellular subscriptions (per 100 inhabitants) 73.9 116.1 96.5 iIndividuals using the Internet (%) 12.8 j 27.7 k 46.5 jTotal trade Major trading partners 2012(million US$) (% of exports) (% of imports)Exports 1 711.8 United States 48.1 United States 35.7Imports 6 580.4 Canada 7.1 Venezuela 15.4Balance –4 868.6 Slovenia 4.2 Trinidad and Tobago 10.6Social indicatorsPopulation growth rate (average annual %) 2010-2015 0.5Urban population growth rate (average annual %) 2010-2015 0.5Rural population growth rate (average annual %) 2010-2015 0.2Urban population (%) 2013 52.2Population aged 0-14 years (%) 2013 27.2Population aged 60+ years (females and males, % of total) 2013 11.7/10.8Sex ratio (males per 100 females) 2013 97.0Life expectancy at birth (females and males, years) 2010-2015 76.0/70.9Infant mortality rate (per 1 000 live births) 2010-2015 20.9Fertility rate, total (live births per woman) 2010-2015 2.3Contraceptive prevalence (ages 15-49, %) 2006-2012 69.0 lInternational migrant stock (000 and % of total population) mid-2013 34.9/1.3Refugees and others of concern to UNHCR mid-2013 20Education: Government expenditure (% of GDP) 2006-2012 6.4Education: Primary-secondary gross enrolment ratio (f/m per 100) 2006-2012 94.4/94.2 mEducation: Female third-level students (% of total) 2006-2012 68.9Intentional homicides (females and males, per 100 000) 2008-2010 10.3/95.2Seats held by women in national parliaments (%) 2014 12.7Environmental indicatorsThreatened species 2013 289Forested area (% of land area) 2011 31.1CO 2 emission estimates (000 metric tons and metric tons per capita) 2010 7 152/2.6Energy consumption per capita (kilograms oil equivalent) 2010 807.0Precipitation in the capital city, total mean (millimetres)813 nTemperature in the capital city, mean °C (minimum and maximum)22.9/31.4 na Market rate. b 2011. c Age group 14 years and over. d The indices are shown in terms of ISIC Rev.2.e The indices are shown in terms of ISIC Rev.3. f Average of quarterly estimates. g Arrivals of non-residenttourists by air. h Includes nationals residing abroad. i Decrease due to the cancellation of subscriptionsas two operators merged. j ITU estimate. k Age group 14 years and over using the Internet via any device.l 2002-2003. m 2004. n Based on monthly averages for the period 1951-1980.100 World Statistics Pocketbook