

STATISTICS
c2drS
c2drS
- No tags were found...

You also want an ePaper? Increase the reach of your titles
YUMPU automatically turns print PDFs into web optimized ePapers that Google loves.
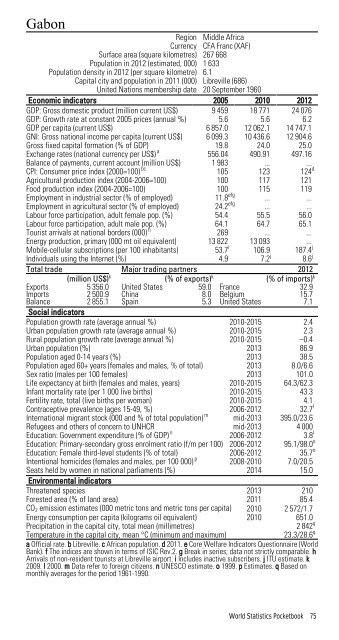
GabonRegion Middle AfricaCurrency CFA Franc (XAF)Surface area (square kilometres) 267 668Population in 2012 (estimated, 000) 1 633Population density in 2012 (per square kilometre) 6.1Capital city and population in 2011 (000) Libreville (686)United Nations membership date 20 September 1960Economic indicators 2005 2010 2012GDP: Gross domestic product (million current US$) 9 459 18 771 24 076GDP: Growth rate at constant 2005 prices (annual %) 5.6 5.6 6.2GDP per capita (current US$) 6 857.0 12 062.1 14 747.1GNI: Gross national income per capita (current US$) 6 099.3 10 436.6 12 904.6Gross fixed capital formation (% of GDP) 19.8 24.0 25.0Exchange rates (national currency per US$) a 556.04 490.91 497.16Balance of payments, current account (million US$) 1 983 ... ...CPI: Consumer price index (2000=100) bc 105 123 124 dAgricultural production index (2004-2006=100) 100 117 121Food production index (2004-2006=100) 100 115 119Employment in industrial sector (% of employed) 11.8 efg ... ...Employment in agricultural sector (% of employed) 24.2 efg ... ...Labour force participation, adult female pop. (%) 54.4 55.5 56.0Labour force participation, adult male pop. (%) 64.1 64.7 65.1Tourist arrivals at national borders (000) h 269 ... ...Energy production, primary (000 mt oil equivalent) 13 822 13 093 ...Mobile-cellular subscriptions (per 100 inhabitants) 53.7 i 106.9 187.4 jIndividuals using the Internet (%) 4.9 7.2 j 8.6 jTotal trade Major trading partners 2012(million US$) k (% of exports) k (% of imports) kExports 5 356.0 United States 59.0 France 32.9Imports 2 500.9 China 8.0 Belgium 15.7Balance 2 855.1 Spain 5.3 United States 7.1Social indicatorsPopulation growth rate (average annual %) 2010-2015 2.4Urban population growth rate (average annual %) 2010-2015 2.3Rural population growth rate (average annual %) 2010-2015 –0.4Urban population (%) 2013 86.9Population aged 0-14 years (%) 2013 38.5Population aged 60+ years (females and males, % of total) 2013 8.0/6.6Sex ratio (males per 100 females) 2013 101.0Life expectancy at birth (females and males, years) 2010-2015 64.3/62.3Infant mortality rate (per 1 000 live births) 2010-2015 43.3Fertility rate, total (live births per woman) 2010-2015 4.1Contraceptive prevalence (ages 15-49, %) 2006-2012 32.7 lInternational migrant stock (000 and % of total population) m mid-2013 395.0/23.6Refugees and others of concern to UNHCR mid-2013 4 000Education: Government expenditure (% of GDP) n 2006-2012 3.8 lEducation: Primary-secondary gross enrolment ratio (f/m per 100) 2006-2012 95.1/98.0 oEducation: Female third-level students (% of total) 2006-2012 35.7 oIntentional homicides (females and males, per 100 000) p 2008-2010 7.0/20.5Seats held by women in national parliaments (%) 2014 15.0Environmental indicatorsThreatened species 2013 210Forested area (% of land area) 2011 85.4CO 2 emission estimates (000 metric tons and metric tons per capita) 2010 2 572/1.7Energy consumption per capita (kilograms oil equivalent) 2010 651.0Precipitation in the capital city, total mean (millimetres)2 842 qTemperature in the capital city, mean °C (minimum and maximum)23.3/28.6 qa Official rate. b Libreville. c African population. d 2011. e Core Welfare Indicators Questionnaire (WorldBank). f The indices are shown in terms of ISIC Rev.2. g Break in series; data not strictly comparable. hArrivals of non-resident tourists at Libreville airport. i Includes inactive subscribers. j ITU estimate. k2009. l 2000. m Data refer to foreign citizens. n UNESCO estimate. o 1999. p Estimates. q Based onmonthly averages for the period 1961-1990.World Statistics Pocketbook 75