

STATISTICS
c2drS
c2drS
- No tags were found...

You also want an ePaper? Increase the reach of your titles
YUMPU automatically turns print PDFs into web optimized ePapers that Google loves.
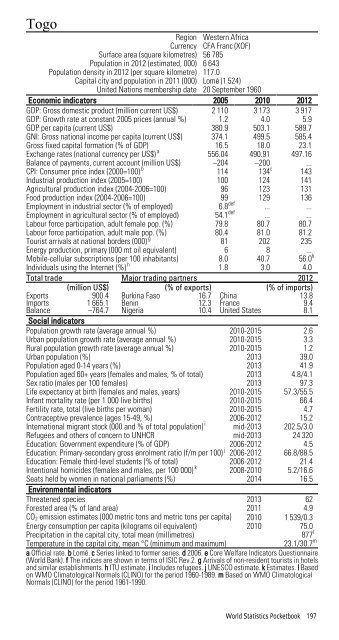
TogoRegion Western AfricaCurrency CFA Franc (XOF)Surface area (square kilometres) 56 785Population in 2012 (estimated, 000) 6 643Population density in 2012 (per square kilometre) 117.0Capital city and population in 2011 (000) Lomé (1 524)United Nations membership date 20 September 1960Economic indicators 2005 2010 2012GDP: Gross domestic product (million current US$) 2 110 3 173 3 917GDP: Growth rate at constant 2005 prices (annual %) 1.2 4.0 5.9GDP per capita (current US$) 380.9 503.1 589.7GNI: Gross national income per capita (current US$) 374.1 499.5 585.4Gross fixed capital formation (% of GDP) 16.5 18.0 23.1Exchange rates (national currency per US$) a 556.04 490.91 497.16Balance of payments, current account (million US$) –204 –200 ...CPI: Consumer price index (2000=100) b 114 134 c 143Industrial production index (2005=100) 100 124 141Agricultural production index (2004-2006=100) 96 123 131Food production index (2004-2006=100) 99 129 136Employment in industrial sector (% of employed) 6.8 def ... ...Employment in agricultural sector (% of employed) 54.1 def ... ...Labour force participation, adult female pop. (%) 79.8 80.7 80.7Labour force participation, adult male pop. (%) 80.4 81.0 81.2Tourist arrivals at national borders (000) g 81 202 235Energy production, primary (000 mt oil equivalent) 6 8 ...Mobile-cellular subscriptions (per 100 inhabitants) 8.0 40.7 56.0 hIndividuals using the Internet (%) h 1.8 3.0 4.0Total trade Major trading partners 2012(million US$) (% of exports) (% of imports)Exports 900.4 Burkina Faso 16.7 China 13.8Imports 1 665.1 Benin 12.3 France 9.4Balance –764.7 Nigeria 10.4 United States 8.1Social indicatorsPopulation growth rate (average annual %) 2010-2015 2.6Urban population growth rate (average annual %) 2010-2015 3.3Rural population growth rate (average annual %) 2010-2015 1.2Urban population (%) 2013 39.0Population aged 0-14 years (%) 2013 41.9Population aged 60+ years (females and males, % of total) 2013 4.8/4.1Sex ratio (males per 100 females) 2013 97.3Life expectancy at birth (females and males, years) 2010-2015 57.3/55.5Infant mortality rate (per 1 000 live births) 2010-2015 66.4Fertility rate, total (live births per woman) 2010-2015 4.7Contraceptive prevalence (ages 15-49, %) 2006-2012 15.2International migrant stock (000 and % of total population) i mid-2013 202.5/3.0Refugees and others of concern to UNHCR mid-2013 24 320Education: Government expenditure (% of GDP) 2006-2012 4.5Education: Primary-secondary gross enrolment ratio (f/m per 100) j 2006-2012 66.8/88.5Education: Female third-level students (% of total) 2006-2012 21.4Intentional homicides (females and males, per 100 000) k 2008-2010 5.2/16.6Seats held by women in national parliaments (%) 2014 16.5Environmental indicatorsThreatened species 2013 62Forested area (% of land area) 2011 4.9CO 2 emission estimates (000 metric tons and metric tons per capita) 2010 1 539/0.3Energy consumption per capita (kilograms oil equivalent) 2010 75.0Precipitation in the capital city, total mean (millimetres)877 lTemperature in the capital city, mean °C (minimum and maximum)23.1/30.7 ma Official rate. b Lomé. c Series linked to former series. d 2006. e Core Welfare Indicators Questionnaire(World Bank). f The indices are shown in terms of ISIC Rev.2. g Arrivals of non-resident tourists in hotelsand similar establishments. h ITU estimate. i Includes refugees. j UNESCO estimate. k Estimates. l Basedon WMO Climatological Normals (CLINO) for the period 1960-1989. m Based on WMO ClimatologicalNormals (CLINO) for the period 1961-1990.World Statistics Pocketbook 197