

STATISTICS
c2drS
c2drS
- No tags were found...

You also want an ePaper? Increase the reach of your titles
YUMPU automatically turns print PDFs into web optimized ePapers that Google loves.
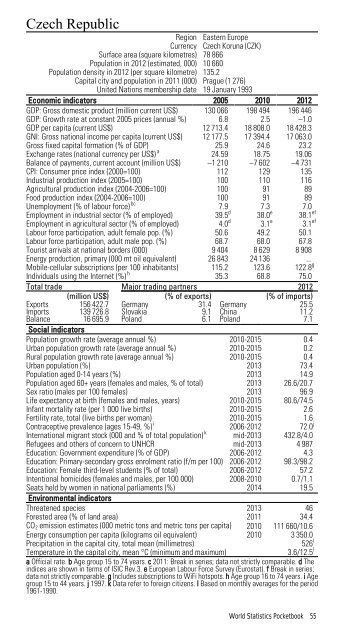
Czech RepublicRegion Eastern EuropeCurrency Czech Koruna (CZK)Surface area (square kilometres) 78 866Population in 2012 (estimated, 000) 10 660Population density in 2012 (per square kilometre) 135.2Capital city and population in 2011 (000) Prague (1 276)United Nations membership date 19 January 1993Economic indicators 2005 2010 2012GDP: Gross domestic product (million current US$) 130 066 198 494 196 446GDP: Growth rate at constant 2005 prices (annual %) 6.8 2.5 –1.0GDP per capita (current US$) 12 713.4 18 808.0 18 428.3GNI: Gross national income per capita (current US$) 12 177.5 17 394.4 17 063.0Gross fixed capital formation (% of GDP) 25.9 24.6 23.2Exchange rates (national currency per US$) a 24.59 18.75 19.06Balance of payments, current account (million US$) –1 210 –7 602 –4 731CPI: Consumer price index (2000=100) 112 129 135Industrial production index (2005=100) 100 110 116Agricultural production index (2004-2006=100) 100 91 89Food production index (2004-2006=100) 100 91 89Unemployment (% of labour force) bc 7.9 7.3 7.0Employment in industrial sector (% of employed) 39.5 d 38.0 e 38.1 efEmployment in agricultural sector (% of employed) 4.0 d 3.1 e 3.1 efLabour force participation, adult female pop. (%) 50.6 49.2 50.1Labour force participation, adult male pop. (%) 68.7 68.0 67.8Tourist arrivals at national borders (000) 9 404 8 629 8 908Energy production, primary (000 mt oil equivalent) 26 843 24 136 ...Mobile-cellular subscriptions (per 100 inhabitants) 115.2 123.6 122.8 gIndividuals using the Internet (%) h 35.3 68.8 75.0Total trade Major trading partners 2012(million US$) (% of exports) (% of imports)Exports 156 422.7 Germany 31.4 Germany 25.5Imports 139 726.8 Slovakia 9.1 China 11.2Balance 16 695.9 Poland 6.1 Poland 7.1Social indicatorsPopulation growth rate (average annual %) 2010-2015 0.4Urban population growth rate (average annual %) 2010-2015 0.2Rural population growth rate (average annual %) 2010-2015 0.4Urban population (%) 2013 73.4Population aged 0-14 years (%) 2013 14.9Population aged 60+ years (females and males, % of total) 2013 26.6/20.7Sex ratio (males per 100 females) 2013 96.9Life expectancy at birth (females and males, years) 2010-2015 80.6/74.5Infant mortality rate (per 1 000 live births) 2010-2015 2.6Fertility rate, total (live births per woman) 2010-2015 1.6Contraceptive prevalence (ages 15-49, %) i 2006-2012 72.0 jInternational migrant stock (000 and % of total population) k mid-2013 432.8/4.0Refugees and others of concern to UNHCR mid-2013 4 987Education: Government expenditure (% of GDP) 2006-2012 4.3Education: Primary-secondary gross enrolment ratio (f/m per 100) 2006-2012 98.3/98.2Education: Female third-level students (% of total) 2006-2012 57.2Intentional homicides (females and males, per 100 000) 2008-2010 0.7/1.1Seats held by women in national parliaments (%) 2014 19.5Environmental indicatorsThreatened species 2013 46Forested area (% of land area) 2011 34.4CO 2 emission estimates (000 metric tons and metric tons per capita) 2010 111 660/10.6Energy consumption per capita (kilograms oil equivalent) 2010 3 350.0Precipitation in the capital city, total mean (millimetres)526 lTemperature in the capital city, mean °C (minimum and maximum)3.6/12.5 la Official rate. b Age group 15 to 74 years. c 2011: Break in series; data not strictly comparable. d Theindices are shown in terms of ISIC Rev.3. e European Labour Force Survey (Eurostat). f Break in series;data not strictly comparable. g Includes subscriptions to WiFi hotspots. h Age group 16 to 74 years. i Agegroup 15 to 44 years. j 1997. k Data refer to foreign citizens. l Based on monthly averages for the period1961-1990.World Statistics Pocketbook 55