

STATISTICS
c2drS
c2drS
- No tags were found...

You also want an ePaper? Increase the reach of your titles
YUMPU automatically turns print PDFs into web optimized ePapers that Google loves.
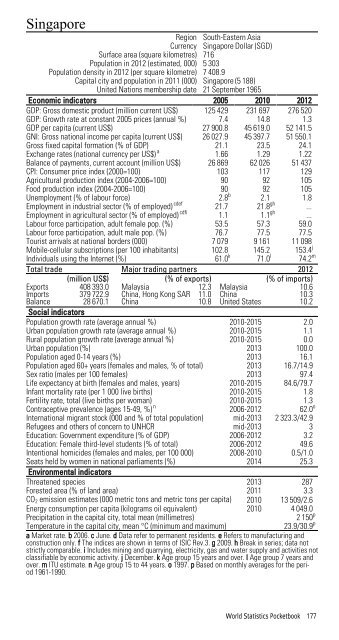
SingaporeRegion South-Eastern AsiaCurrency Singapore Dollar (SGD)Surface area (square kilometres) 716Population in 2012 (estimated, 000) 5 303Population density in 2012 (per square kilometre) 7 408.9Capital city and population in 2011 (000) Singapore (5 188)United Nations membership date 21 September 1965Economic indicators 2005 2010 2012GDP: Gross domestic product (million current US$) 125 429 231 697 276 520GDP: Growth rate at constant 2005 prices (annual %) 7.4 14.8 1.3GDP per capita (current US$) 27 900.8 45 619.0 52 141.5GNI: Gross national income per capita (current US$) 26 027.9 45 397.7 51 550.1Gross fixed capital formation (% of GDP) 21.1 23.5 24.1Exchange rates (national currency per US$) a 1.66 1.29 1.22Balance of payments, current account (million US$) 26 869 62 026 51 437CPI: Consumer price index (2000=100) 103 117 129Agricultural production index (2004-2006=100) 90 92 105Food production index (2004-2006=100) 90 92 105Unemployment (% of labour force) 2.8 b 2.1 1.8Employment in industrial sector (% of employed) cdef 21.7 21.8 gh ...Employment in agricultural sector (% of employed) cdfi 1.1 1.1 gh ...Labour force participation, adult female pop. (%) 53.5 57.3 59.0Labour force participation, adult male pop. (%) 76.7 77.5 77.5Tourist arrivals at national borders (000) 7 079 9 161 11 098Mobile-cellular subscriptions (per 100 inhabitants) 102.8 145.2 153.4 jIndividuals using the Internet (%) 61.0 k 71.0 l 74.2 mTotal trade Major trading partners 2012(million US$) (% of exports) (% of imports)Exports 408 393.0 Malaysia 12.3 Malaysia 10.6Imports 379 722.9 China, Hong Kong SAR 11.0 China 10.3Balance 28 670.1 China 10.8 United States 10.2Social indicatorsPopulation growth rate (average annual %) 2010-2015 2.0Urban population growth rate (average annual %) 2010-2015 1.1Rural population growth rate (average annual %) 2010-2015 0.0Urban population (%) 2013 100.0Population aged 0-14 years (%) 2013 16.1Population aged 60+ years (females and males, % of total) 2013 16.7/14.9Sex ratio (males per 100 females) 2013 97.4Life expectancy at birth (females and males, years) 2010-2015 84.6/79.7Infant mortality rate (per 1 000 live births) 2010-2015 1.8Fertility rate, total (live births per woman) 2010-2015 1.3Contraceptive prevalence (ages 15-49, %) n 2006-2012 62.0 oInternational migrant stock (000 and % of total population) mid-2013 2 323.3/42.9Refugees and others of concern to UNHCR mid-2013 3Education: Government expenditure (% of GDP) 2006-2012 3.2Education: Female third-level students (% of total) 2006-2012 49.6Intentional homicides (females and males, per 100 000) 2008-2010 0.5/1.0Seats held by women in national parliaments (%) 2014 25.3Environmental indicatorsThreatened species 2013 287Forested area (% of land area) 2011 3.3CO 2 emission estimates (000 metric tons and metric tons per capita) 2010 13 509/2.6Energy consumption per capita (kilograms oil equivalent) 2010 4 049.0Precipitation in the capital city, total mean (millimetres)2 150 pTemperature in the capital city, mean °C (minimum and maximum)23.9/30.9 pa Market rate. b 2006. c June. d Data refer to permanent residents. e Refers to manufacturing andconstruction only. f The indices are shown in terms of ISIC Rev.3. g 2009. h Break in series; data notstrictly comparable. i Includes mining and quarrying, electricity, gas and water supply and activities notclassifiable by economic activity. j December. k Age group 15 years and over. l Age group 7 years andover. m ITU estimate. n Age group 15 to 44 years. o 1997. p Based on monthly averages for the period1961-1990.World Statistics Pocketbook 177