

STATISTICS
c2drS
c2drS
- No tags were found...

Create successful ePaper yourself
Turn your PDF publications into a flip-book with our unique Google optimized e-Paper software.
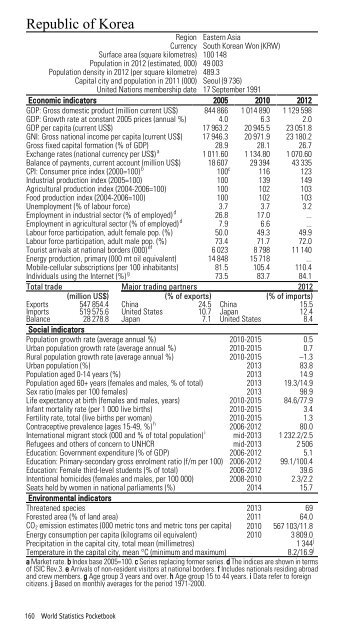
Republic of KoreaRegion Eastern AsiaCurrency South Korean Won (KRW)Surface area (square kilometres) 100 148Population in 2012 (estimated, 000) 49 003Population density in 2012 (per square kilometre) 489.3Capital city and population in 2011 (000) Seoul (9 736)United Nations membership date 17 September 1991Economic indicators 2005 2010 2012GDP: Gross domestic product (million current US$) 844 866 1 014 890 1 129 598GDP: Growth rate at constant 2005 prices (annual %) 4.0 6.3 2.0GDP per capita (current US$) 17 963.2 20 945.5 23 051.8GNI: Gross national income per capita (current US$) 17 946.3 20 971.9 23 180.2Gross fixed capital formation (% of GDP) 28.9 28.1 26.7Exchange rates (national currency per US$) a 1 011.60 1 134.80 1 070.60Balance of payments, current account (million US$) 18 607 29 394 43 335CPI: Consumer price index (2000=100) b 100 c 116 123Industrial production index (2005=100) 100 139 149Agricultural production index (2004-2006=100) 100 102 103Food production index (2004-2006=100) 100 102 103Unemployment (% of labour force) 3.7 3.7 3.2Employment in industrial sector (% of employed) d 26.8 17.0 ...Employment in agricultural sector (% of employed) d 7.9 6.6 ...Labour force participation, adult female pop. (%) 50.0 49.3 49.9Labour force participation, adult male pop. (%) 73.4 71.7 72.0Tourist arrivals at national borders (000) ef 6 023 8 798 11 140Energy production, primary (000 mt oil equivalent) 14 848 15 718 ...Mobile-cellular subscriptions (per 100 inhabitants) 81.5 105.4 110.4Individuals using the Internet (%) g 73.5 83.7 84.1Total trade Major trading partners 2012(million US$) (% of exports) (% of imports)Exports 547 854.4 China 24.5 China 15.5Imports 519 575.6 United States 10.7 Japan 12.4Balance 28 278.8 Japan 7.1 United States 8.4Social indicatorsPopulation growth rate (average annual %) 2010-2015 0.5Urban population growth rate (average annual %) 2010-2015 0.7Rural population growth rate (average annual %) 2010-2015 –1.3Urban population (%) 2013 83.8Population aged 0-14 years (%) 2013 14.9Population aged 60+ years (females and males, % of total) 2013 19.3/14.9Sex ratio (males per 100 females) 2013 98.9Life expectancy at birth (females and males, years) 2010-2015 84.6/77.9Infant mortality rate (per 1 000 live births) 2010-2015 3.4Fertility rate, total (live births per woman) 2010-2015 1.3Contraceptive prevalence (ages 15-49, %) h 2006-2012 80.0International migrant stock (000 and % of total population) i mid-2013 1 232.2/2.5Refugees and others of concern to UNHCR mid-2013 2 506Education: Government expenditure (% of GDP) 2006-2012 5.1Education: Primary-secondary gross enrolment ratio (f/m per 100) 2006-2012 99.1/100.4Education: Female third-level students (% of total) 2006-2012 39.6Intentional homicides (females and males, per 100 000) 2008-2010 2.3/2.2Seats held by women in national parliaments (%) 2014 15.7Environmental indicatorsThreatened species 2013 69Forested area (% of land area) 2011 64.0CO 2 emission estimates (000 metric tons and metric tons per capita) 2010 567 103/11.8Energy consumption per capita (kilograms oil equivalent) 2010 3 809.0Precipitation in the capital city, total mean (millimetres)1 344 jTemperature in the capital city, mean °C (minimum and maximum)8.2/16.9 ja Market rate. b Index base 2005=100. c Series replacing former series. d The indices are shown in termsof ISIC Rev.3. e Arrivals of non-resident visitors at national borders. f Includes nationals residing abroadand crew members. g Age group 3 years and over. h Age group 15 to 44 years. i Data refer to foreigncitizens. j Based on monthly averages for the period 1971-2000.160 World Statistics Pocketbook