

STATISTICS
c2drS
c2drS
- No tags were found...

You also want an ePaper? Increase the reach of your titles
YUMPU automatically turns print PDFs into web optimized ePapers that Google loves.
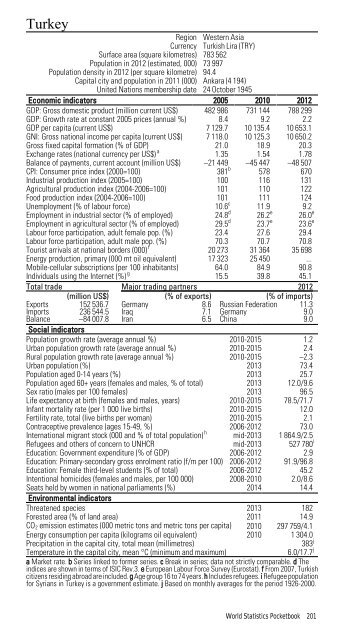
TurkeyRegion Western AsiaCurrency Turkish Lira (TRY)Surface area (square kilometres) 783 562Population in 2012 (estimated, 000) 73 997Population density in 2012 (per square kilometre) 94.4Capital city and population in 2011 (000) Ankara (4 194)United Nations membership date 24 October 1945Economic indicators 2005 2010 2012GDP: Gross domestic product (million current US$) 482 986 731 144 788 299GDP: Growth rate at constant 2005 prices (annual %) 8.4 9.2 2.2GDP per capita (current US$) 7 129.7 10 135.4 10 653.1GNI: Gross national income per capita (current US$) 7 118.0 10 125.3 10 650.2Gross fixed capital formation (% of GDP) 21.0 18.9 20.3Exchange rates (national currency per US$) a 1.35 1.54 1.78Balance of payments, current account (million US$) –21 449 –45 447 –48 507CPI: Consumer price index (2000=100) 381 b 578 670Industrial production index (2005=100) 100 116 131Agricultural production index (2004-2006=100) 101 110 122Food production index (2004-2006=100) 101 111 124Unemployment (% of labour force) 10.6 c 11.9 9.2Employment in industrial sector (% of employed) 24.8 d 26.2 e 26.0 eEmployment in agricultural sector (% of employed) 29.5 d 23.7 e 23.6 eLabour force participation, adult female pop. (%) 23.4 27.6 29.4Labour force participation, adult male pop. (%) 70.3 70.7 70.8Tourist arrivals at national borders (000) f 20 273 31 364 35 698Energy production, primary (000 mt oil equivalent) 17 323 25 450 ...Mobile-cellular subscriptions (per 100 inhabitants) 64.0 84.9 90.8Individuals using the Internet (%) g 15.5 39.8 45.1Total trade Major trading partners 2012(million US$) (% of exports) (% of imports)Exports 152 536.7 Germany 8.6 Russian Federation 11.3Imports 236 544.5 Iraq 7.1 Germany 9.0Balance –84 007.8 Iran 6.5 China 9.0Social indicatorsPopulation growth rate (average annual %) 2010-2015 1.2Urban population growth rate (average annual %) 2010-2015 2.4Rural population growth rate (average annual %) 2010-2015 –2.3Urban population (%) 2013 73.4Population aged 0-14 years (%) 2013 25.7Population aged 60+ years (females and males, % of total) 2013 12.0/9.6Sex ratio (males per 100 females) 2013 96.5Life expectancy at birth (females and males, years) 2010-2015 78.5/71.7Infant mortality rate (per 1 000 live births) 2010-2015 12.0Fertility rate, total (live births per woman) 2010-2015 2.1Contraceptive prevalence (ages 15-49, %) 2006-2012 73.0International migrant stock (000 and % of total population) h mid-2013 1 864.9/2.5Refugees and others of concern to UNHCR mid-2013 527 780 iEducation: Government expenditure (% of GDP) 2006-2012 2.9Education: Primary-secondary gross enrolment ratio (f/m per 100) 2006-2012 91.9/96.8Education: Female third-level students (% of total) 2006-2012 45.2Intentional homicides (females and males, per 100 000) 2008-2010 2.0/8.6Seats held by women in national parliaments (%) 2014 14.4Environmental indicatorsThreatened species 2013 182Forested area (% of land area) 2011 14.9CO 2 emission estimates (000 metric tons and metric tons per capita) 2010 297 759/4.1Energy consumption per capita (kilograms oil equivalent) 2010 1 304.0Precipitation in the capital city, total mean (millimetres)383 jTemperature in the capital city, mean °C (minimum and maximum)6.0/17.7 ja Market rate. b Series linked to former series. c Break in series; data not strictly comparable. d Theindices are shown in terms of ISIC Rev.3. e European Labour Force Survey (Eurostat). f From 2007, Turkishcitizens residing abroad are included. g Age group 16 to 74 years. h Includes refugees. i Refugee populationfor Syrians in Turkey is a government estimate. j Based on monthly averages for the period 1926-2000.World Statistics Pocketbook 201