

STATISTICS
c2drS
c2drS
- No tags were found...

Create successful ePaper yourself
Turn your PDF publications into a flip-book with our unique Google optimized e-Paper software.
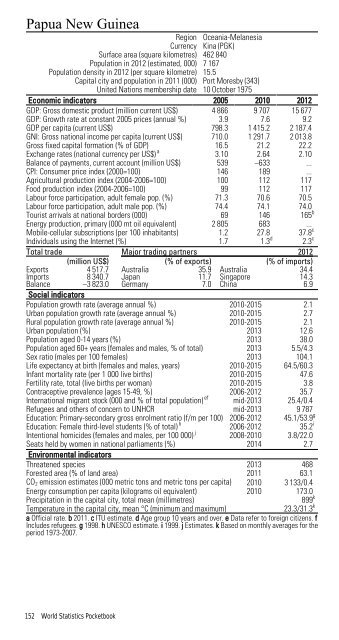
Papua New GuineaRegion Oceania-MelanesiaCurrency Kina (PGK)Surface area (square kilometres) 462 840Population in 2012 (estimated, 000) 7 167Population density in 2012 (per square kilometre) 15.5Capital city and population in 2011 (000) Port Moresby (343)United Nations membership date 10 October 1975Economic indicators 2005 2010 2012GDP: Gross domestic product (million current US$) 4 866 9 707 15 677GDP: Growth rate at constant 2005 prices (annual %) 3.9 7.6 9.2GDP per capita (current US$) 798.3 1 415.2 2 187.4GNI: Gross national income per capita (current US$) 710.0 1 291.7 2 013.8Gross fixed capital formation (% of GDP) 16.5 21.2 22.2Exchange rates (national currency per US$) a 3.10 2.64 2.10Balance of payments, current account (million US$) 539 –633 ...CPI: Consumer price index (2000=100) 146 189 ...Agricultural production index (2004-2006=100) 100 112 117Food production index (2004-2006=100) 99 112 117Labour force participation, adult female pop. (%) 71.3 70.6 70.5Labour force participation, adult male pop. (%) 74.4 74.1 74.0Tourist arrivals at national borders (000) 69 146 165 bEnergy production, primary (000 mt oil equivalent) 2 805 683 ...Mobile-cellular subscriptions (per 100 inhabitants) 1.2 27.8 37.8 cIndividuals using the Internet (%) 1.7 1.3 d 2.3 cTotal trade Major trading partners 2012(million US$) (% of exports) (% of imports)Exports 4 517.7 Australia 35.9 Australia 34.4Imports 8 340.7 Japan 11.7 Singapore 14.3Balance –3 823.0 Germany 7.0 China 6.9Social indicatorsPopulation growth rate (average annual %) 2010-2015 2.1Urban population growth rate (average annual %) 2010-2015 2.7Rural population growth rate (average annual %) 2010-2015 2.1Urban population (%) 2013 12.6Population aged 0-14 years (%) 2013 38.0Population aged 60+ years (females and males, % of total) 2013 5.5/4.3Sex ratio (males per 100 females) 2013 104.1Life expectancy at birth (females and males, years) 2010-2015 64.5/60.3Infant mortality rate (per 1 000 live births) 2010-2015 47.6Fertility rate, total (live births per woman) 2010-2015 3.8Contraceptive prevalence (ages 15-49, %) 2006-2012 35.7International migrant stock (000 and % of total population) ef mid-2013 25.4/0.4Refugees and others of concern to UNHCR mid-2013 9 787Education: Primary-secondary gross enrolment ratio (f/m per 100) 2006-2012 45.1/53.9 gEducation: Female third-level students (% of total) h 2006-2012 35.2 iIntentional homicides (females and males, per 100 000) j 2008-2010 3.8/22.0Seats held by women in national parliaments (%) 2014 2.7Environmental indicatorsThreatened species 2013 468Forested area (% of land area) 2011 63.1CO 2 emission estimates (000 metric tons and metric tons per capita) 2010 3 133/0.4Energy consumption per capita (kilograms oil equivalent) 2010 173.0Precipitation in the capital city, total mean (millimetres)899 kTemperature in the capital city, mean °C (minimum and maximum)23.3/31.3 ka Official rate. b 2011. c ITU estimate. d Age group 10 years and over. e Data refer to foreign citizens. fIncludes refugees. g 1998. h UNESCO estimate. i 1999. j Estimates. k Based on monthly averages for theperiod 1973-2007.152 World Statistics Pocketbook