

STATISTICS
c2drS
c2drS
- No tags were found...

You also want an ePaper? Increase the reach of your titles
YUMPU automatically turns print PDFs into web optimized ePapers that Google loves.
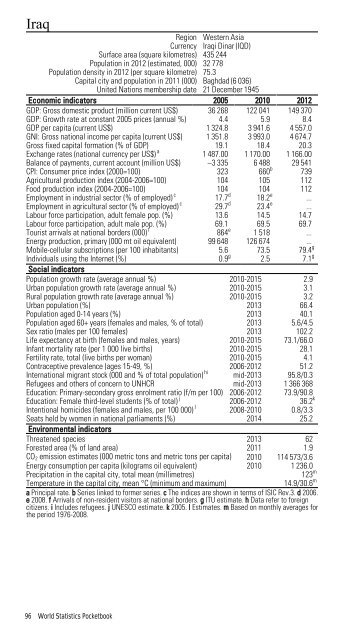
IraqRegion Western AsiaCurrency Iraqi Dinar (IQD)Surface area (square kilometres) 435 244Population in 2012 (estimated, 000) 32 778Population density in 2012 (per square kilometre) 75.3Capital city and population in 2011 (000) Baghdad (6 036)United Nations membership date 21 December 1945Economic indicators 2005 2010 2012GDP: Gross domestic product (million current US$) 36 268 122 041 149 370GDP: Growth rate at constant 2005 prices (annual %) 4.4 5.9 8.4GDP per capita (current US$) 1 324.8 3 941.6 4 557.0GNI: Gross national income per capita (current US$) 1 351.8 3 993.0 4 674.7Gross fixed capital formation (% of GDP) 19.1 18.4 20.3Exchange rates (national currency per US$) a 1 487.00 1 170.00 1 166.00Balance of payments, current account (million US$) –3 335 6 488 29 541CPI: Consumer price index (2000=100) 323 660 b 739Agricultural production index (2004-2006=100) 104 105 112Food production index (2004-2006=100) 104 104 112Employment in industrial sector (% of employed) c 17.7 d 18.2 e ...Employment in agricultural sector (% of employed) c 29.7 d 23.4 e ...Labour force participation, adult female pop. (%) 13.6 14.5 14.7Labour force participation, adult male pop. (%) 69.1 69.5 69.7Tourist arrivals at national borders (000) f 864 e 1 518 ...Energy production, primary (000 mt oil equivalent) 99 648 126 674 ...Mobile-cellular subscriptions (per 100 inhabitants) 5.6 73.5 79.4 gIndividuals using the Internet (%) 0.9 g 2.5 7.1 gSocial indicatorsPopulation growth rate (average annual %) 2010-2015 2.9Urban population growth rate (average annual %) 2010-2015 3.1Rural population growth rate (average annual %) 2010-2015 3.2Urban population (%) 2013 66.4Population aged 0-14 years (%) 2013 40.1Population aged 60+ years (females and males, % of total) 2013 5.6/4.5Sex ratio (males per 100 females) 2013 102.2Life expectancy at birth (females and males, years) 2010-2015 73.1/66.0Infant mortality rate (per 1 000 live births) 2010-2015 28.1Fertility rate, total (live births per woman) 2010-2015 4.1Contraceptive prevalence (ages 15-49, %) 2006-2012 51.2International migrant stock (000 and % of total population) hi mid-2013 95.8/0.3Refugees and others of concern to UNHCR mid-2013 1 366 368Education: Primary-secondary gross enrolment ratio (f/m per 100) 2006-2012 73.9/90.8Education: Female third-level students (% of total) j 2006-2012 36.2 kIntentional homicides (females and males, per 100 000) l 2008-2010 0.8/3.3Seats held by women in national parliaments (%) 2014 25.2Environmental indicatorsThreatened species 2013 62Forested area (% of land area) 2011 1.9CO 2 emission estimates (000 metric tons and metric tons per capita) 2010 114 573/3.6Energy consumption per capita (kilograms oil equivalent) 2010 1 236.0Precipitation in the capital city, total mean (millimetres)123 mTemperature in the capital city, mean °C (minimum and maximum)14.9/30.6 ma Principal rate. b Series linked to former series. c The indices are shown in terms of ISIC Rev.3. d 2006.e 2008. f Arrivals of non-resident visitors at national borders. g ITU estimate. h Data refer to foreigncitizens. i Includes refugees. j UNESCO estimate. k 2005. l Estimates. m Based on monthly averages forthe period 1976-2008.96 World Statistics Pocketbook