

STATISTICS
c2drS
c2drS
- No tags were found...

Create successful ePaper yourself
Turn your PDF publications into a flip-book with our unique Google optimized e-Paper software.
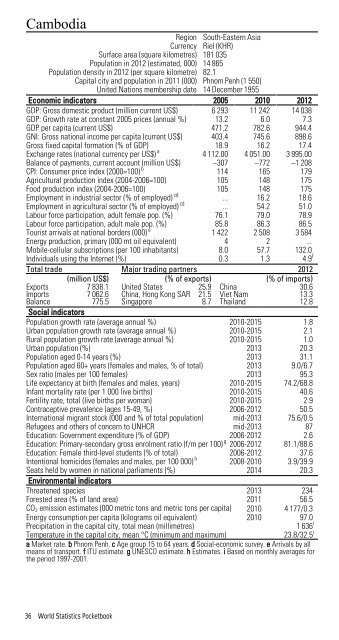
CambodiaRegion South-Eastern AsiaCurrency Riel (KHR)Surface area (square kilometres) 181 035Population in 2012 (estimated, 000) 14 865Population density in 2012 (per square kilometre) 82.1Capital city and population in 2011 (000) Phnom Penh (1 550)United Nations membership date 14 December 1955Economic indicators 2005 2010 2012GDP: Gross domestic product (million current US$) 6 293 11 242 14 038GDP: Growth rate at constant 2005 prices (annual %) 13.2 6.0 7.3GDP per capita (current US$) 471.2 782.6 944.4GNI: Gross national income per capita (current US$) 403.4 745.6 898.6Gross fixed capital formation (% of GDP) 18.9 16.2 17.4Exchange rates (national currency per US$) a 4 112.00 4 051.00 3 995.00Balance of payments, current account (million US$) –307 –772 –1 208CPI: Consumer price index (2000=100) b 114 165 179Agricultural production index (2004-2006=100) 105 148 175Food production index (2004-2006=100) 105 148 175Employment in industrial sector (% of employed) cd ... 16.2 18.6Employment in agricultural sector (% of employed) cd ... 54.2 51.0Labour force participation, adult female pop. (%) 76.1 79.0 78.9Labour force participation, adult male pop. (%) 85.8 86.3 86.5Tourist arrivals at national borders (000) e 1 422 2 508 3 584Energy production, primary (000 mt oil equivalent) 4 2 ...Mobile-cellular subscriptions (per 100 inhabitants) 8.0 57.7 132.0Individuals using the Internet (%) 0.3 1.3 4.9 fTotal trade Major trading partners 2012(million US$) (% of exports) (% of imports)Exports 7 838.1 United States 25.9 China 30.6Imports 7 062.6 China, Hong Kong SAR 21.5 Viet Nam 13.3Balance 775.5 Singapore 8.7 Thailand 12.8Social indicatorsPopulation growth rate (average annual %) 2010-2015 1.8Urban population growth rate (average annual %) 2010-2015 2.1Rural population growth rate (average annual %) 2010-2015 1.0Urban population (%) 2013 20.3Population aged 0-14 years (%) 2013 31.1Population aged 60+ years (females and males, % of total) 2013 9.0/6.7Sex ratio (males per 100 females) 2013 95.3Life expectancy at birth (females and males, years) 2010-2015 74.2/68.8Infant mortality rate (per 1 000 live births) 2010-2015 40.6Fertility rate, total (live births per woman) 2010-2015 2.9Contraceptive prevalence (ages 15-49, %) 2006-2012 50.5International migrant stock (000 and % of total population) mid-2013 75.6/0.5Refugees and others of concern to UNHCR mid-2013 87Education: Government expenditure (% of GDP) 2006-2012 2.6Education: Primary-secondary gross enrolment ratio (f/m per 100) g 2006-2012 81.1/88.6Education: Female third-level students (% of total) 2006-2012 37.6Intentional homicides (females and males, per 100 000) h 2008-2010 3.9/39.9Seats held by women in national parliaments (%) 2014 20.3Environmental indicatorsThreatened species 2013 234Forested area (% of land area) 2011 56.5CO 2 emission estimates (000 metric tons and metric tons per capita) 2010 4 177/0.3Energy consumption per capita (kilograms oil equivalent) 2010 97.0Precipitation in the capital city, total mean (millimetres)1 636 iTemperature in the capital city, mean °C (minimum and maximum)23.8/32.5 ia Market rate. b Phnom Penh. c Age group 15 to 64 years. d Social-economic survey. e Arrivals by allmeans of transport. f ITU estimate. g UNESCO estimate. h Estimates. i Based on monthly averages forthe period 1997-2001.36 World Statistics Pocketbook