

STATISTICS
c2drS
c2drS
- No tags were found...

You also want an ePaper? Increase the reach of your titles
YUMPU automatically turns print PDFs into web optimized ePapers that Google loves.
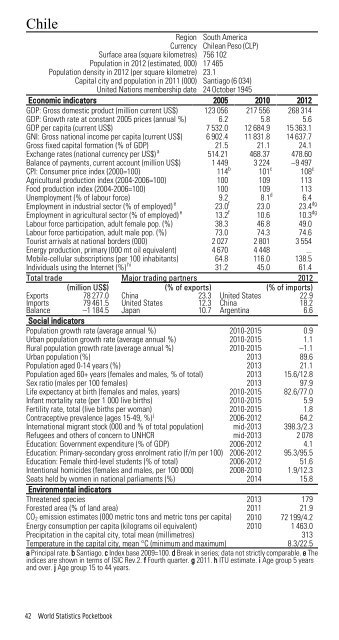
ChileRegion South AmericaCurrency Chilean Peso (CLP)Surface area (square kilometres) 756 102Population in 2012 (estimated, 000) 17 465Population density in 2012 (per square kilometre) 23.1Capital city and population in 2011 (000) Santiago (6 034)United Nations membership date 24 October 1945Economic indicators 2005 2010 2012GDP: Gross domestic product (million current US$) 123 056 217 556 268 314GDP: Growth rate at constant 2005 prices (annual %) 6.2 5.8 5.6GDP per capita (current US$) 7 532.0 12 684.9 15 363.1GNI: Gross national income per capita (current US$) 6 902.4 11 831.8 14 637.7Gross fixed capital formation (% of GDP) 21.5 21.1 24.1Exchange rates (national currency per US$) a 514.21 468.37 478.60Balance of payments, current account (million US$) 1 449 3 224 –9 497CPI: Consumer price index (2000=100) 114 b 101 c 108 cAgricultural production index (2004-2006=100) 100 109 113Food production index (2004-2006=100) 100 109 113Unemployment (% of labour force) 9.2 8.1 d 6.4Employment in industrial sector (% of employed) e 23.0 f 23.0 23.4 dgEmployment in agricultural sector (% of employed) e 13.2 f 10.6 10.3 dgLabour force participation, adult female pop. (%) 38.3 46.8 49.0Labour force participation, adult male pop. (%) 73.0 74.3 74.6Tourist arrivals at national borders (000) 2 027 2 801 3 554Energy production, primary (000 mt oil equivalent) 4 670 4 448 ...Mobile-cellular subscriptions (per 100 inhabitants) 64.8 116.0 138.5Individuals using the Internet (%) hi 31.2 45.0 61.4Total trade Major trading partners 2012(million US$) (% of exports) (% of imports)Exports 78 277.0 China 23.3 United States 22.9Imports 79 461.5 United States 12.3 China 18.2Balance –1 184.5 Japan 10.7 Argentina 6.6Social indicatorsPopulation growth rate (average annual %) 2010-2015 0.9Urban population growth rate (average annual %) 2010-2015 1.1Rural population growth rate (average annual %) 2010-2015 –1.1Urban population (%) 2013 89.6Population aged 0-14 years (%) 2013 21.1Population aged 60+ years (females and males, % of total) 2013 15.6/12.8Sex ratio (males per 100 females) 2013 97.9Life expectancy at birth (females and males, years) 2010-2015 82.6/77.0Infant mortality rate (per 1 000 live births) 2010-2015 5.9Fertility rate, total (live births per woman) 2010-2015 1.8Contraceptive prevalence (ages 15-49, %) j 2006-2012 64.2International migrant stock (000 and % of total population) mid-2013 398.3/2.3Refugees and others of concern to UNHCR mid-2013 2 078Education: Government expenditure (% of GDP) 2006-2012 4.1Education: Primary-secondary gross enrolment ratio (f/m per 100) 2006-2012 95.3/95.5Education: Female third-level students (% of total) 2006-2012 51.6Intentional homicides (females and males, per 100 000) 2008-2010 1.9/12.3Seats held by women in national parliaments (%) 2014 15.8Environmental indicatorsThreatened species 2013 179Forested area (% of land area) 2011 21.9CO 2 emission estimates (000 metric tons and metric tons per capita) 2010 72 199/4.2Energy consumption per capita (kilograms oil equivalent) 2010 1 463.0Precipitation in the capital city, total mean (millimetres) 313Temperature in the capital city, mean °C (minimum and maximum) 8.3/22.5a Principal rate. b Santiago. c Index base 2009=100. d Break in series; data not strictly comparable. e Theindices are shown in terms of ISIC Rev.2. f Fourth quarter. g 2011. h ITU estimate. i Age group 5 yearsand over. j Age group 15 to 44 years.42 World Statistics Pocketbook