

STATISTICS
c2drS
c2drS
- No tags were found...

You also want an ePaper? Increase the reach of your titles
YUMPU automatically turns print PDFs into web optimized ePapers that Google loves.
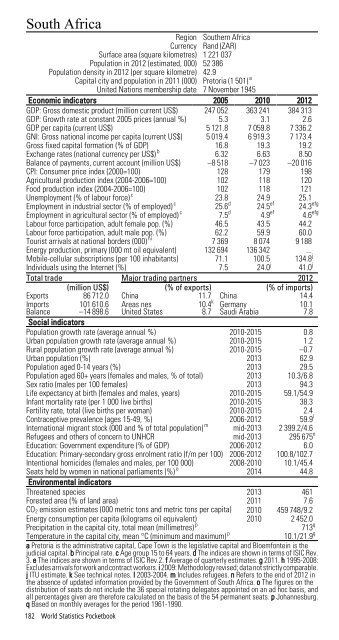
South AfricaRegion Southern AfricaCurrency Rand (ZAR)Surface area (square kilometres) 1 221 037Population in 2012 (estimated, 000) 52 386Population density in 2012 (per square kilometre) 42.9Capital city and population in 2011 (000) Pretoria (1 501) aUnited Nations membership date 7 November 1945Economic indicators 2005 2010 2012GDP: Gross domestic product (million current US$) 247 052 363 241 384 313GDP: Growth rate at constant 2005 prices (annual %) 5.3 3.1 2.6GDP per capita (current US$) 5 121.8 7 059.8 7 336.2GNI: Gross national income per capita (current US$) 5 019.4 6 919.3 7 173.4Gross fixed capital formation (% of GDP) 16.8 19.3 19.2Exchange rates (national currency per US$) b 6.32 6.63 8.50Balance of payments, current account (million US$) –8 518 –7 023 –20 016CPI: Consumer price index (2000=100) 128 179 198Agricultural production index (2004-2006=100) 102 118 120Food production index (2004-2006=100) 102 118 121Unemployment (% of labour force) c 23.8 24.9 25.1Employment in industrial sector (% of employed) c 25.6 d 24.5 ef 24.3 efgEmployment in agricultural sector (% of employed) c 7.5 d 4.9 ef 4.6 efgLabour force participation, adult female pop. (%) 46.5 43.5 44.2Labour force participation, adult male pop. (%) 62.2 59.9 60.0Tourist arrivals at national borders (000) hi 7 369 8 074 9 188Energy production, primary (000 mt oil equivalent) 132 694 136 342 ...Mobile-cellular subscriptions (per 100 inhabitants) 71.1 100.5 134.8 jIndividuals using the Internet (%) 7.5 24.0 j 41.0 jTotal trade Major trading partners 2012(million US$) (% of exports) (% of imports)Exports 86 712.0 China 11.7 China 14.4ImportsBalance101 610.6–14 898.6Areas nesUnited States10.4 k8.7GermanySaudi Arabia10.17.8Social indicatorsPopulation growth rate (average annual %) 2010-2015 0.8Urban population growth rate (average annual %) 2010-2015 1.2Rural population growth rate (average annual %) 2010-2015 –0.7Urban population (%) 2013 62.9Population aged 0-14 years (%) 2013 29.5Population aged 60+ years (females and males, % of total) 2013 10.3/6.8Sex ratio (males per 100 females) 2013 94.3Life expectancy at birth (females and males, years) 2010-2015 59.1/54.9Infant mortality rate (per 1 000 live births) 2010-2015 38.3Fertility rate, total (live births per woman) 2010-2015 2.4Contraceptive prevalence (ages 15-49, %) 2006-2012 59.9 lInternational migrant stock (000 and % of total population) m mid-2013 2 399.2/4.6Refugees and others of concern to UNHCR mid-2013 295 675 nEducation: Government expenditure (% of GDP) 2006-2012 6.0Education: Primary-secondary gross enrolment ratio (f/m per 100) 2006-2012 100.8/102.7Intentional homicides (females and males, per 100 000) 2008-2010 10.1/45.4Seats held by women in national parliaments (%) o 2014 44.8Environmental indicatorsThreatened species 2013 461Forested area (% of land area) 2011 7.6CO 2 emission estimates (000 metric tons and metric tons per capita) 2010 459 748/9.2Energy consumption per capita (kilograms oil equivalent) 2010 2 452.0Precipitation in the capital city, total mean (millimetres) p713 qTemperature in the capital city, mean °C (minimum and maximum) p10.1/21.9 qa Pretoria is the administrative capital, Cape Town is the legislative capital and Bloemfontein is thejudicial capital. b Principal rate. c Age group 15 to 64 years. d The indices are shown in terms of ISIC Rev.3. e The indices are shown in terms of ISIC Rev.2. f Average of quarterly estimates. g 2011. h 1995-2008:Excludes arrivals for work and contract workers. i 2009: Methodology revised; data not strictly comparable.j ITU estimate. k See technical notes. l 2003-2004. m Includes refugees. n Refers to the end of 2012 inthe absence of updated information provided by the Government of South Africa. o The figures on thedistribution of seats do not include the 36 special rotating delegates appointed on an ad hoc basis, andall percentages given are therefore calculated on the basis of the 54 permanent seats. p Johannesburg.q Based on monthly averages for the period 1961-1990.182 World Statistics Pocketbook