

STATISTICS
c2drS
c2drS
- No tags were found...

You also want an ePaper? Increase the reach of your titles
YUMPU automatically turns print PDFs into web optimized ePapers that Google loves.
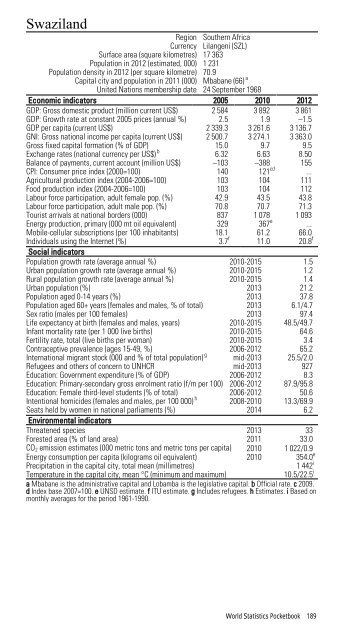
SwazilandRegion Southern AfricaCurrency Lilangeni (SZL)Surface area (square kilometres) 17 363Population in 2012 (estimated, 000) 1 231Population density in 2012 (per square kilometre) 70.9Capital city and population in 2011 (000) Mbabane (66) aUnited Nations membership date 24 September 1968Economic indicators 2005 2010 2012GDP: Gross domestic product (million current US$) 2 584 3 892 3 861GDP: Growth rate at constant 2005 prices (annual %) 2.5 1.9 –1.5GDP per capita (current US$) 2 339.3 3 261.6 3 136.7GNI: Gross national income per capita (current US$) 2 500.7 3 274.1 3 363.0Gross fixed capital formation (% of GDP) 15.0 9.7 9.5Exchange rates (national currency per US$) b 6.32 6.63 8.50Balance of payments, current account (million US$) –103 –388 155CPI: Consumer price index (2000=100) 140 121 cd ...Agricultural production index (2004-2006=100) 103 104 111Food production index (2004-2006=100) 103 104 112Labour force participation, adult female pop. (%) 42.9 43.5 43.8Labour force participation, adult male pop. (%) 70.8 70.7 71.3Tourist arrivals at national borders (000) 837 1 078 1 093Energy production, primary (000 mt oil equivalent) 329 367 e ...Mobile-cellular subscriptions (per 100 inhabitants) 18.1 61.2 66.0Individuals using the Internet (%) 3.7 f 11.0 20.8 fSocial indicatorsPopulation growth rate (average annual %) 2010-2015 1.5Urban population growth rate (average annual %) 2010-2015 1.2Rural population growth rate (average annual %) 2010-2015 1.4Urban population (%) 2013 21.2Population aged 0-14 years (%) 2013 37.8Population aged 60+ years (females and males, % of total) 2013 6.1/4.7Sex ratio (males per 100 females) 2013 97.4Life expectancy at birth (females and males, years) 2010-2015 48.5/49.7Infant mortality rate (per 1 000 live births) 2010-2015 64.6Fertility rate, total (live births per woman) 2010-2015 3.4Contraceptive prevalence (ages 15-49, %) 2006-2012 65.2International migrant stock (000 and % of total population) g mid-2013 25.5/2.0Refugees and others of concern to UNHCR mid-2013 927Education: Government expenditure (% of GDP) 2006-2012 8.3Education: Primary-secondary gross enrolment ratio (f/m per 100) 2006-2012 87.9/95.8Education: Female third-level students (% of total) 2006-2012 50.6Intentional homicides (females and males, per 100 000) h 2008-2010 13.3/69.9Seats held by women in national parliaments (%) 2014 6.2Environmental indicatorsThreatened species 2013 33Forested area (% of land area) 2011 33.0CO 2 emission estimates (000 metric tons and metric tons per capita) 2010 1 022/0.9Energy consumption per capita (kilograms oil equivalent) 2010 354.0 ePrecipitation in the capital city, total mean (millimetres)1 442 iTemperature in the capital city, mean °C (minimum and maximum)10.5/22.5 ia Mbabane is the administrative capital and Lobamba is the legislative capital. b Official rate. c 2009.d Index base 2007=100. e UNSD estimate. f ITU estimate. g Includes refugees. h Estimates. i Based onmonthly averages for the period 1961-1990.World Statistics Pocketbook 189