

STATISTICS
c2drS
c2drS
- No tags were found...

Create successful ePaper yourself
Turn your PDF publications into a flip-book with our unique Google optimized e-Paper software.
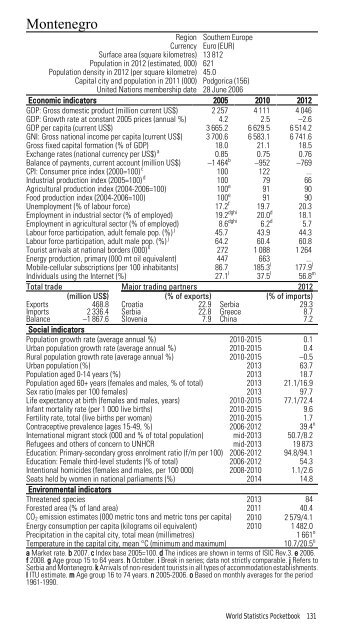
MontenegroRegion Southern EuropeCurrency Euro (EUR)Surface area (square kilometres) 13 812Population in 2012 (estimated, 000) 621Population density in 2012 (per square kilometre) 45.0Capital city and population in 2011 (000) Podgorica (156)United Nations membership date 28 June 2006Economic indicators 2005 2010 2012GDP: Gross domestic product (million current US$) 2 257 4 111 4 046GDP: Growth rate at constant 2005 prices (annual %) 4.2 2.5 –2.6GDP per capita (current US$) 3 665.2 6 629.5 6 514.2GNI: Gross national income per capita (current US$) 3 700.6 6 583.1 6 741.6Gross fixed capital formation (% of GDP) 18.0 21.1 18.5Exchange rates (national currency per US$) a 0.85 0.75 0.76Balance of payments, current account (million US$) –1 464 b –952 –769CPI: Consumer price index (2000=100) c 100 122 ...Industrial production index (2005=100) d 100 79 66Agricultural production index (2004-2006=100) 100 e 91 90Food production index (2004-2006=100) 100 e 91 90Unemployment (% of labour force) 17.2 f 19.7 20.3Employment in industrial sector (% of employed) 19.2 dghi 20.0 d 18.1Employment in agricultural sector (% of employed) 8.6 dghi 6.2 d 5.7Labour force participation, adult female pop. (%) j 45.7 43.9 44.3Labour force participation, adult male pop. (%) j 64.2 60.4 60.8Tourist arrivals at national borders (000) k 272 1 088 1 264Energy production, primary (000 mt oil equivalent) 447 663 ...Mobile-cellular subscriptions (per 100 inhabitants) 86.7 185.3 l 177.9 lIndividuals using the Internet (%) 27.1 l 37.5 l 56.8 mTotal trade Major trading partners 2012(million US$) (% of exports) (% of imports)Exports 468.8 Croatia 22.9 Serbia 29.3Imports 2 336.4 Serbia 22.8 Greece 8.7Balance –1 867.6 Slovenia 7.9 China 7.2Social indicatorsPopulation growth rate (average annual %) 2010-2015 0.1Urban population growth rate (average annual %) 2010-2015 0.4Rural population growth rate (average annual %) 2010-2015 –0.5Urban population (%) 2013 63.7Population aged 0-14 years (%) 2013 18.7Population aged 60+ years (females and males, % of total) 2013 21.1/16.9Sex ratio (males per 100 females) 2013 97.7Life expectancy at birth (females and males, years) 2010-2015 77.1/72.4Infant mortality rate (per 1 000 live births) 2010-2015 9.6Fertility rate, total (live births per woman) 2010-2015 1.7Contraceptive prevalence (ages 15-49, %) 2006-2012 39.4 nInternational migrant stock (000 and % of total population) mid-2013 50.7/8.2Refugees and others of concern to UNHCR mid-2013 19 873Education: Primary-secondary gross enrolment ratio (f/m per 100) 2006-2012 94.8/94.1Education: Female third-level students (% of total) 2006-2012 54.3Intentional homicides (females and males, per 100 000) 2008-2010 1.1/2.6Seats held by women in national parliaments (%) 2014 14.8Environmental indicatorsThreatened species 2013 84Forested area (% of land area) 2011 40.4CO 2 emission estimates (000 metric tons and metric tons per capita) 2010 2 579/4.1Energy consumption per capita (kilograms oil equivalent) 2010 1 482.0Precipitation in the capital city, total mean (millimetres)1 661 oTemperature in the capital city, mean °C (minimum and maximum)10.7/20.5 oa Market rate. b 2007. c Index base 2005=100. d The indices are shown in terms of ISIC Rev.3. e 2006.f 2008. g Age group 15 to 64 years. h October. i Break in series; data not strictly comparable. j Refers toSerbia and Montenegro. k Arrivals of non-resident tourists in all types of accommodation establishments.l ITU estimate. m Age group 16 to 74 years. n 2005-2006. o Based on monthly averages for the period1961-1990.World Statistics Pocketbook 131