

STATISTICS
c2drS
c2drS
- No tags were found...

You also want an ePaper? Increase the reach of your titles
YUMPU automatically turns print PDFs into web optimized ePapers that Google loves.
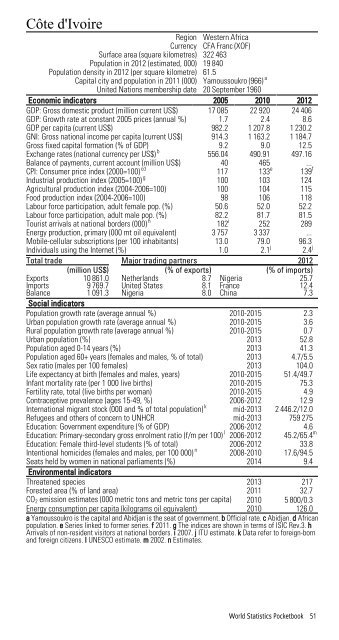
Côte d'IvoireRegion Western AfricaCurrency CFA Franc (XOF)Surface area (square kilometres) 322 463Population in 2012 (estimated, 000) 19 840Population density in 2012 (per square kilometre) 61.5Capital city and population in 2011 (000) Yamoussoukro (966) aUnited Nations membership date 20 September 1960Economic indicators 2005 2010 2012GDP: Gross domestic product (million current US$) 17 085 22 920 24 406GDP: Growth rate at constant 2005 prices (annual %) 1.7 2.4 8.6GDP per capita (current US$) 982.2 1 207.8 1 230.2GNI: Gross national income per capita (current US$) 914.3 1 163.2 1 184.7Gross fixed capital formation (% of GDP) 9.2 9.0 12.5Exchange rates (national currency per US$) b 556.04 490.91 497.16Balance of payments, current account (million US$) 40 465 ...CPI: Consumer price index (2000=100) cd 117 133 e 139 fIndustrial production index (2005=100) g 100 103 124Agricultural production index (2004-2006=100) 100 104 115Food production index (2004-2006=100) 98 106 118Labour force participation, adult female pop. (%) 50.6 52.0 52.2Labour force participation, adult male pop. (%) 82.2 81.7 81.5Tourist arrivals at national borders (000) h 182 i 252 289Energy production, primary (000 mt oil equivalent) 3 757 3 337 ...Mobile-cellular subscriptions (per 100 inhabitants) 13.0 79.0 96.3Individuals using the Internet (%) 1.0 2.1 j 2.4 jTotal trade Major trading partners 2012(million US$) (% of exports) (% of imports)Exports 10 861.0 Netherlands 8.7 Nigeria 25.7Imports 9 769.7 United States 8.1 France 12.4Balance 1 091.3 Nigeria 8.0 China 7.3Social indicatorsPopulation growth rate (average annual %) 2010-2015 2.3Urban population growth rate (average annual %) 2010-2015 3.6Rural population growth rate (average annual %) 2010-2015 0.7Urban population (%) 2013 52.8Population aged 0-14 years (%) 2013 41.3Population aged 60+ years (females and males, % of total) 2013 4.7/5.5Sex ratio (males per 100 females) 2013 104.0Life expectancy at birth (females and males, years) 2010-2015 51.4/49.7Infant mortality rate (per 1 000 live births) 2010-2015 75.3Fertility rate, total (live births per woman) 2010-2015 4.9Contraceptive prevalence (ages 15-49, %) 2006-2012 12.9International migrant stock (000 and % of total population) k mid-2013 2 446.2/12.0Refugees and others of concern to UNHCR mid-2013 759 275Education: Government expenditure (% of GDP) 2006-2012 4.6Education: Primary-secondary gross enrolment ratio (f/m per 100) l 2006-2012 45.2/65.4 mEducation: Female third-level students (% of total) 2006-2012 33.8Intentional homicides (females and males, per 100 000) n 2008-2010 17.6/94.5Seats held by women in national parliaments (%) 2014 9.4Environmental indicatorsThreatened species 2013 217Forested area (% of land area) 2011 32.7CO 2 emission estimates (000 metric tons and metric tons per capita) 2010 5 800/0.3Energy consumption per capita (kilograms oil equivalent) 2010 126.0a Yamoussoukro is the capital and Abidjan is the seat of government. b Official rate. c Abidjan. d Africanpopulation. e Series linked to former series. f 2011. g The indices are shown in terms of ISIC Rev.3. hArrivals of non-resident visitors at national borders. i 2007. j ITU estimate. k Data refer to foreign-bornand foreign citizens. l UNESCO estimate. m 2002. n Estimates.World Statistics Pocketbook 51