

STATISTICS
c2drS
c2drS
- No tags were found...

Create successful ePaper yourself
Turn your PDF publications into a flip-book with our unique Google optimized e-Paper software.
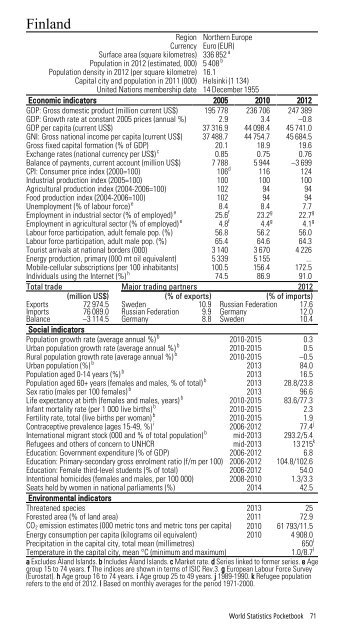
FinlandRegion Northern EuropeCurrency Euro (EUR)Surface area (square kilometres) 336 852 aPopulation in 2012 (estimated, 000) 5 408 bPopulation density in 2012 (per square kilometre) 16.1Capital city and population in 2011 (000) Helsinki (1 134)United Nations membership date 14 December 1955Economic indicators 2005 2010 2012GDP: Gross domestic product (million current US$) 195 778 236 706 247 389GDP: Growth rate at constant 2005 prices (annual %) 2.9 3.4 –0.8GDP per capita (current US$) 37 316.9 44 098.4 45 741.0GNI: Gross national income per capita (current US$) 37 488.7 44 754.7 45 684.5Gross fixed capital formation (% of GDP) 20.1 18.9 19.6Exchange rates (national currency per US$) c 0.85 0.75 0.76Balance of payments, current account (million US$) 7 788 5 944 –3 699CPI: Consumer price index (2000=100) 106 d 116 124Industrial production index (2005=100) 100 100 100Agricultural production index (2004-2006=100) 102 94 94Food production index (2004-2006=100) 102 94 94Unemployment (% of labour force) e 8.4 8.4 7.7Employment in industrial sector (% of employed) e 25.6 f 23.2 g 22.7 gEmployment in agricultural sector (% of employed) e 4.8 f 4.4 g 4.1 gLabour force participation, adult female pop. (%) 56.8 56.2 56.0Labour force participation, adult male pop. (%) 65.4 64.6 64.3Tourist arrivals at national borders (000) 3 140 3 670 4 226Energy production, primary (000 mt oil equivalent) 5 339 5 155 ...Mobile-cellular subscriptions (per 100 inhabitants) 100.5 156.4 172.5Individuals using the Internet (%) h 74.5 86.9 91.0Total trade Major trading partners 2012(million US$) (% of exports) (% of imports)Exports 72 974.5 Sweden 10.9 Russian Federation 17.6Imports 76 089.0 Russian Federation 9.9 Germany 12.0Balance –3 114.5 Germany 8.8 Sweden 10.4Social indicatorsPopulation growth rate (average annual %) b 2010-2015 0.3Urban population growth rate (average annual %) b 2010-2015 0.5Rural population growth rate (average annual %) b 2010-2015 –0.5Urban population (%) b 2013 84.0Population aged 0-14 years (%) b 2013 16.5Population aged 60+ years (females and males, % of total) b 2013 28.8/23.8Sex ratio (males per 100 females) b 2013 96.6Life expectancy at birth (females and males, years) b 2010-2015 83.6/77.3Infant mortality rate (per 1 000 live births) b 2010-2015 2.3Fertility rate, total (live births per woman) b 2010-2015 1.9Contraceptive prevalence (ages 15-49, %) i 2006-2012 77.4 jInternational migrant stock (000 and % of total population) b mid-2013 293.2/5.4Refugees and others of concern to UNHCR mid-2013 13 215 kEducation: Government expenditure (% of GDP) 2006-2012 6.8Education: Primary-secondary gross enrolment ratio (f/m per 100) 2006-2012 104.8/102.6Education: Female third-level students (% of total) 2006-2012 54.0Intentional homicides (females and males, per 100 000) 2008-2010 1.3/3.3Seats held by women in national parliaments (%) 2014 42.5Environmental indicatorsThreatened species 2013 25Forested area (% of land area) 2011 72.9CO 2 emission estimates (000 metric tons and metric tons per capita) 2010 61 793/11.5Energy consumption per capita (kilograms oil equivalent) 2010 4 908.0Precipitation in the capital city, total mean (millimetres)650 lTemperature in the capital city, mean °C (minimum and maximum)1.0/8.7 la Excludes Åland Islands. b Includes Åland Islands. c Market rate. d Series linked to former series. e Agegroup 15 to 74 years. f The indices are shown in terms of ISIC Rev.3. g European Labour Force Survey(Eurostat). h Age group 16 to 74 years. i Age group 25 to 49 years. j 1989-1990. k Refugee populationrefers to the end of 2012. l Based on monthly averages for the period 1971-2000.World Statistics Pocketbook 71